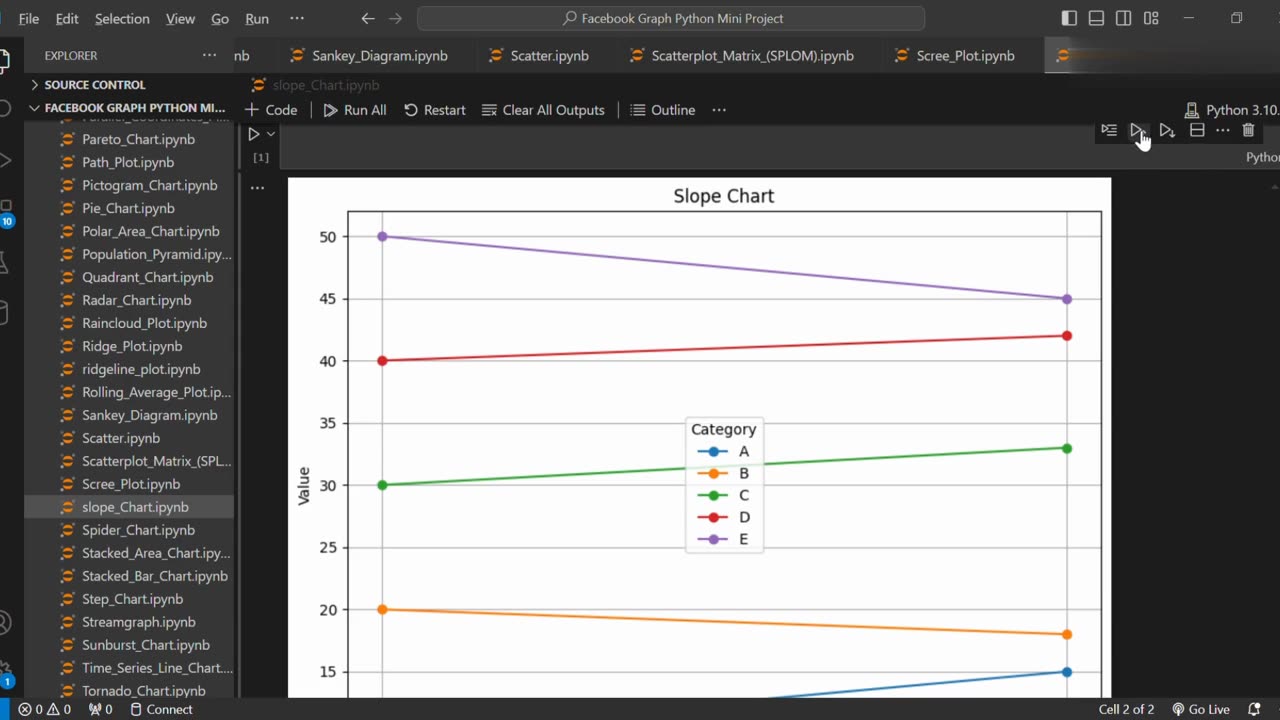
↗️ Create Slope Chart Using Python
Loading 1 comment...
-
 0:20
0:20
AI Evolutionary Technology
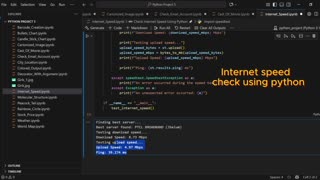
3 days agoUsing Python to Analyze Your Internet Connection
21 -
 LIVE
LIVE
LFA TV
9 hours agoDEVOTION & BREAKING NEWS! | WEDNESDAY 10/1/25
10,598 watching -
 1:11:31
JULIE GREEN MINISTRIES
2 hours agoLIVE WITH JULIE
40.5K76 -
 35:39
35:39
Producer Michael
16 hours agoROLLS-ROYCE SPECTRE TEST DRIVE GOES WRONG!
32.5K3 -
 15:42
15:42
Nicholas Bowling
14 hours ago $1.79 earnedCharlie’s MURDER Sparks COLLEGE STUDENTS to Boldly Preach the Gospel!
8.88K15 -
 40:10
40:10
Uncommon Sense In Current Times
17 hours ago $1.52 earnedDeconstruction of Christianity | Tim Barnett on Truth, Faith & the Crisis in Today’s Church
22K2 -
 LIVE
LIVE
Total Horse Channel
12 hours ago2025 Quarter Horse Congress * Celeste Center * Wednesday October 1st
94 watching -
 LIVE
LIVE
The Bubba Army
22 hours agoGOVERNMENT SHUTDOWN! - Bubba the Love Sponge® Show | 10/01/25
2,121 watching -
 7:22
7:22
Adam Does Movies
19 hours ago $0.69 earnedThe Smashing Machine - Movie Review
15.8K1 -
 5:15
5:15
Blackstone Griddles
13 hours agoCreamy Cajun Linguine with Bruce Mitchell on the Blackstone Griddle
21.9K1