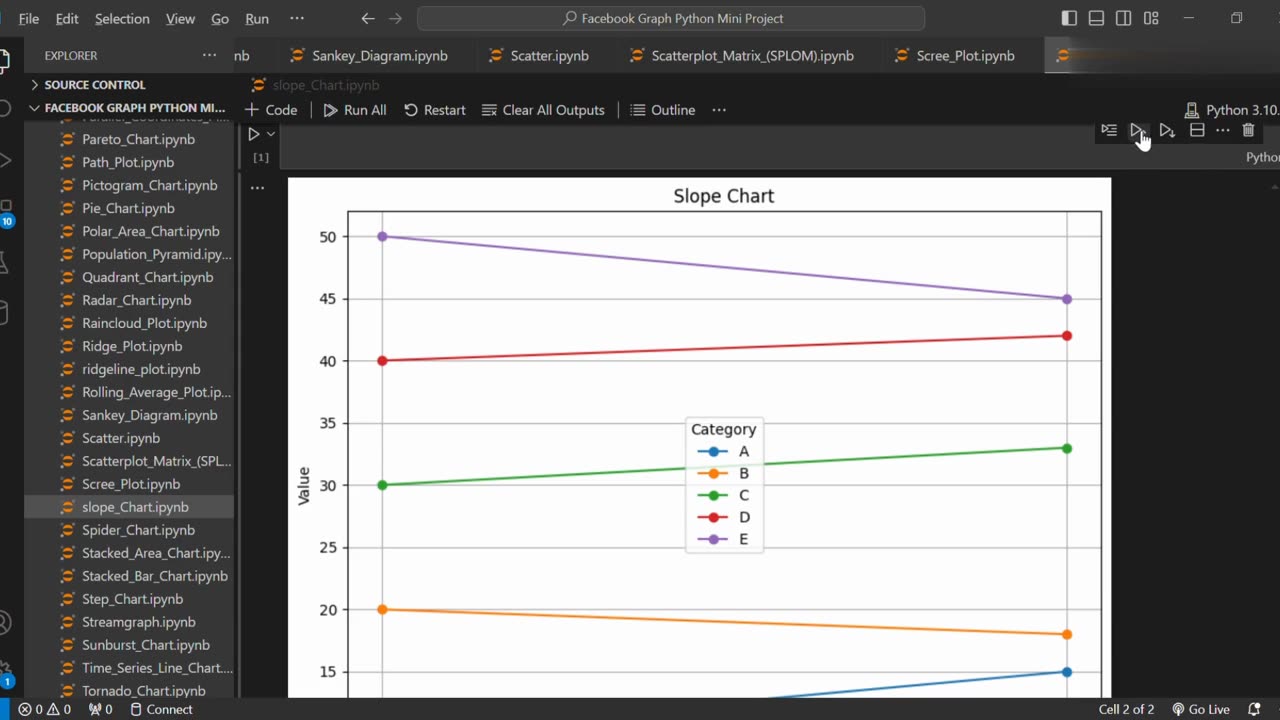
↗️ Create Slope Chart Using Python
Loading 1 comment...
-
 1:02
1:02
AI Evolutionary Technology
2 months agoLive Weather App in Python | BeautifulSoup & Web Scraping Tutorial
101 -
 LIVE
LIVE
vivafrei
2 hours agoBREAKING: Jan. 6 Pipe Bomber Prosecutor is the SAME ONE Who Prosecuted Enrique Tarrio?
6,194 watching -
 20:08
20:08
MYLUNCHBREAK CHANNEL PAGE
6 hours agoThe Field Museum is From Another Timeline
3.13K2 -
 LIVE
LIVE
SpartakusLIVE
3 hours agoSOLOS on ARC Raiders || WZ Stream LATER
2,400 watching -
 LIVE
LIVE
Side Scrollers Podcast
5 hours agoSide Scrollers Presents: QUEEN OF THE Wii
456 watching -
 LIVE
LIVE
GritsGG
4 hours agoBO7 Warzone Is Here! Win Streaking! New Leaderboard?
337 watching -
 1:00:55
Jeff Ahern
4 hours ago $6.55 earnedThe Saturday show with Jeff Ahern
37.8K15 -
 LIVE
LIVE
Ouhel
6 hours agoSATURDAY | Battlefield 6 | Going for the Queen in Arc after | O'HELL LIVE |
58 watching -
 LIVE
LIVE
ShivEmUp
4 hours ago🔴LIVE🔴🔵Battlefield 6🔵Game Changing Updates?🔵Grumpy Bird🔵
56 watching -
 LIVE
LIVE
Grant Cardone
6 hours agoHow to Find Your First $1million Profit In Real Estate
968 watching