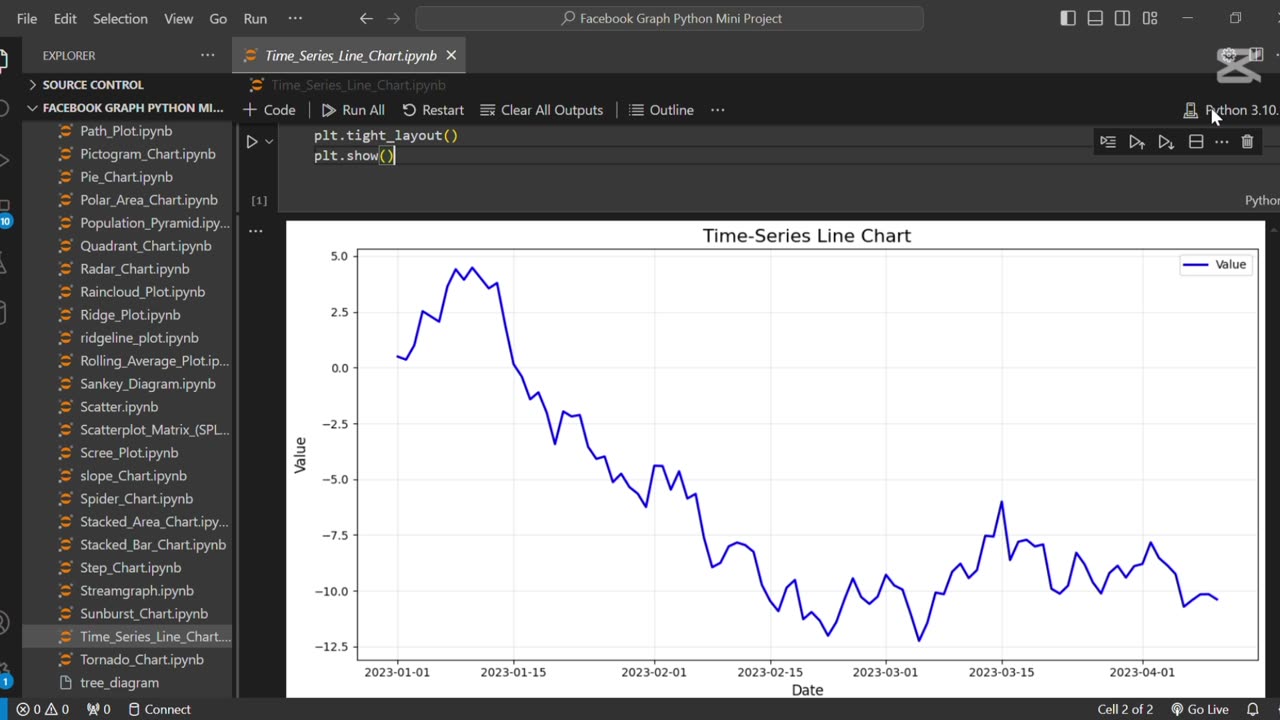
⏳ Create The Time Series Line Chart Using Python
Loading comments...
-
 1:15
1:15
AI Evolutionary Technology
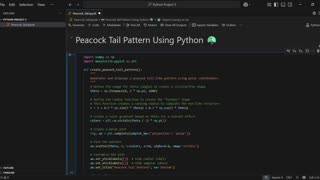
1 day agoCreating a Stunning Peacock Tail Pattern with Python & Matplotlib
21 -
 LIVE
LIVE
The Shannon Joy Show
1 hour ago🔥🔥Could Trump Trigger The Globalist Great Reset?🔥🔥
216 watching -
 LIVE
LIVE
Trumpet Daily
1 hour agoTrumpet Daily LIVE | Sept. 9, 2025
427 watching -
 27:46
27:46
Rethinking the Dollar
2 hours agoUS Jobs Report DECEPTION – Precious Metals Smell Blood (Fed To Cut BIG) | Morning Check-In: Let's Talk...
5.58K2 -
 1:00:08
VINCE
4 hours agoBREAKING: Trump Goes To 'War' In Chicago | Episode 121 - 09/09/25
146K133 -
 LIVE
LIVE
LFA TV
6 hours agoLFA TV ALL DAY STREAM - TUESDAY 9/9/25
4,676 watching -
 1:34:42
Dear America
4 hours agoTrump DESTROYS Dems: ‘Blood On Their Hands!’ — America Won’t Survive Without Law & Order”
84K49 -
 2:00:14
Nerdrotic
5 hours ago $2.87 earnedUFO Disclosure Hearing LIVE REACTION - Forbidden Frontier #116
27.9K7 -
 29:06
29:06
Clownfish TV
3 hours agoRIP YouTube! It Hurt Itself in Its Confusion... | Clownfish TV
18.1K18 -
 1:24:23
The Big Mig™
3 hours agoGrand Jury Empaneled for Anthony Weiner Laptop
13.8K9