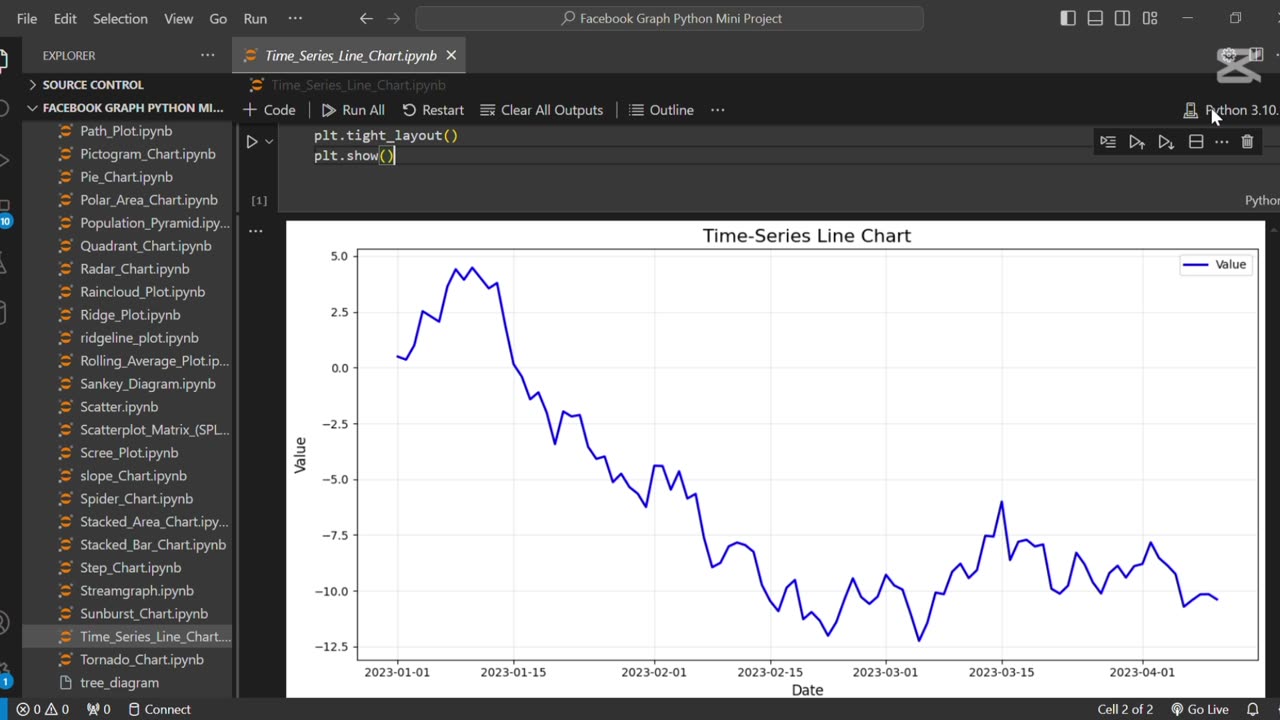
⏳ Create The Time Series Line Chart Using Python
Loading comments...
-
 0:17
0:17
AI Evolutionary Technology
16 days agoVisualizing Molecular Structure From SMILES Using RDKit 🧪
1 -
 LIVE
LIVE
Total Horse Channel
12 hours ago2025 Quarter Horse Congress * Celeste Center * Wednesday October 1st
94 watching -
 LIVE
LIVE
The Bubba Army
22 hours agoGOVERNMENT SHUTDOWN! - Bubba the Love Sponge® Show | 10/01/25
2,121 watching -
 7:22
7:22
Adam Does Movies
19 hours ago $0.69 earnedThe Smashing Machine - Movie Review
15.8K1 -
 5:15
5:15
Blackstone Griddles
13 hours agoCreamy Cajun Linguine with Bruce Mitchell on the Blackstone Griddle
21.9K1 -
 9:18
9:18
Freedom Frontline
18 hours agoMarco Rubio DESTROYS Stephanopoulos And Exposes USAID Scam
14.7K13 -
 0:39
0:39
OfficialJadenWilliams
4 days agoRealizing you're stuck in the Back Rooms
19K -
 9:14
9:14
The Art of Improvement
1 day ago $0.81 earnedHow to Stop Overthinking
13.3K -
 8:33
8:33
Damon Imani
18 hours agoDamon OBLITERATES Everyone On The View For 8 Minutes Straight! | Compilation Vol.16
13.7K7 -
 18:08
18:08
Actual Justice Warrior
22 hours agoMamdani CRIES Victim After Eric Adams Drops Out
23.9K21