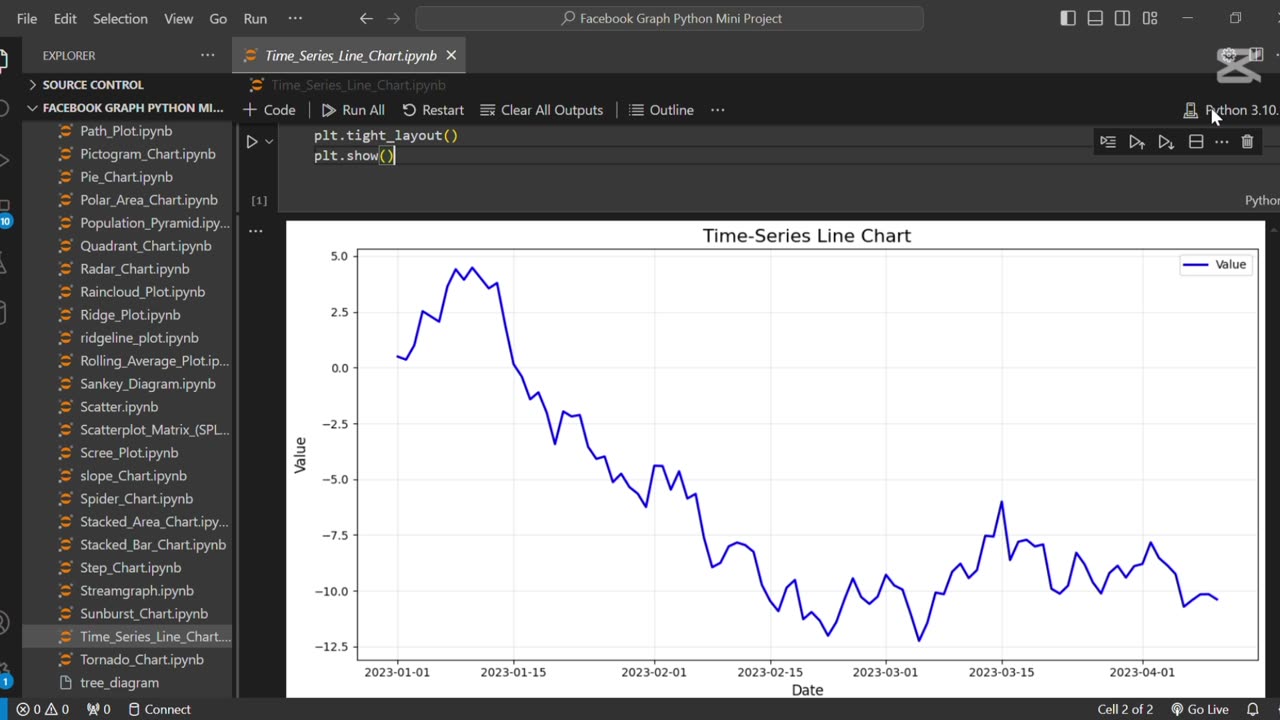
⏳ Create The Time Series Line Chart Using Python
Loading comments...
-
 0:17
0:17
AI Evolutionary Technology
2 months agoVisualizing Molecular Structure From SMILES Using RDKit 🧪
5 -
 15:04
15:04
MetatronGaming
1 day agoOriginal Commodore 64 VS C64 Maxi - Review and Comparison
18.2K7 -
 9:46
9:46
MattMorseTV
13 hours ago $16.18 earnedTrump just SHUT DOWN a $287,000,000 FRAUD RING.
17.9K77 -
 15:48
15:48
GritsGG
15 hours agoWinning a Rare Solos Prison End Game on Warzone!
13.3K1 -
 11:37
11:37
The Pascal Show
15 hours ago $3.68 earnedTHEY WANT TO END HER?! Candace Owens Claims French President & First Lady Put A H*t Out On Her?!
11.7K13 -
 LIVE
LIVE
Lofi Girl
2 years agoSynthwave Radio 🌌 - beats to chill/game to
455 watching -
 24:30
24:30
DeVory Darkins
16 hours agoMarjorie Taylor Greene RESIGNS as Minnesota dealt MAJOR BLOW after fraud scheme exposed
78.7K125 -
 2:19:48
Badlands Media
1 day agoDevolution Power Hour Ep. 409: Panic in the Narrative — Epstein, Israel, and the Manufactured Meltdowns
172K60 -
 1:52:38
Man in America
13 hours agoCommunists VS Zionists & the Collapse of the American Empire w/ Michael Yon
78.9K61 -
 4:09:34
Akademiks
8 hours agoSheck Wes exposes Fake Industry. Future Not supportin his mans? D4VD had help w disposing his ex?
46.9K3