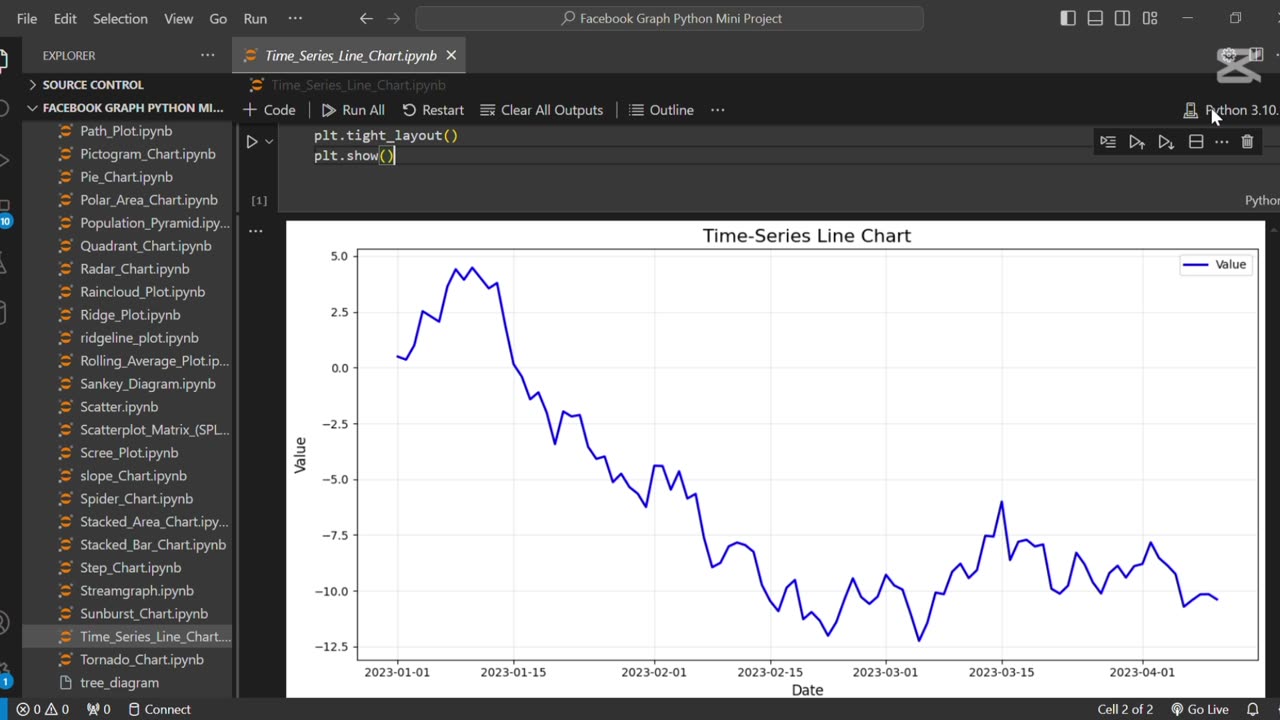
⏳ Create The Time Series Line Chart Using Python
Loading comments...
-
 0:20
0:20
AI Evolutionary Technology
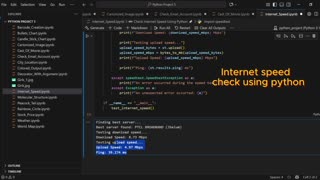
1 month agoUsing Python to Analyze Your Internet Connection
101 -
 21:38
21:38
Professor Nez
20 hours agoTrump JUST BROKE the INTERNET with SAVAGE Line on Ilhan Omar!
42.3K58 -
 1:17:52
Dialogue works
3 days ago $10.17 earnedMartin Armstrong: This Is How World War III Starts… And It Already Has
36.4K18 -
 38:16
38:16
daniellesmithab
3 days agoAlberta Update: Getting Kids Back to the Classroom
28.4K11 -
 20:48
20:48
BlaireWhite
5 days agoTrans TikTokers Are Crashing Out (Over Nothing)
32.6K11 -
 2:07:06
Side Scrollers Podcast
22 hours agoHasan Piker CAUGHT LYING AGAIN + Twitch URGES LEFTIST IDEOLOGY + More | Side Scrollers
74.8K11 -
 8:40
8:40
MattMorseTV
17 hours ago $14.34 earnedSchumer just KICKED OFF the Left-Wing CIVIL WAR.
35.8K33 -
 21:39
21:39
Nikko Ortiz
2 days agoI Take A North Korean Shooting
33.5K6 -
 1:46:26
The Michelle Moore Show
21 hours ago'The Religion Invasion In the U.S. and the Deep State Agenda' Guest, Mark Taylor: The Michelle Moore Show (Nov 3, 2025)
41.9K41 -
 LIVE
LIVE
TruthStream with Joe and Scott
5 days agoSovereign Codes & Cosmic Infrastructure,Ufo's, UAP's, Monads, Matrix Satellites, Interstellar Visitors, SYRONA #505
311 watching