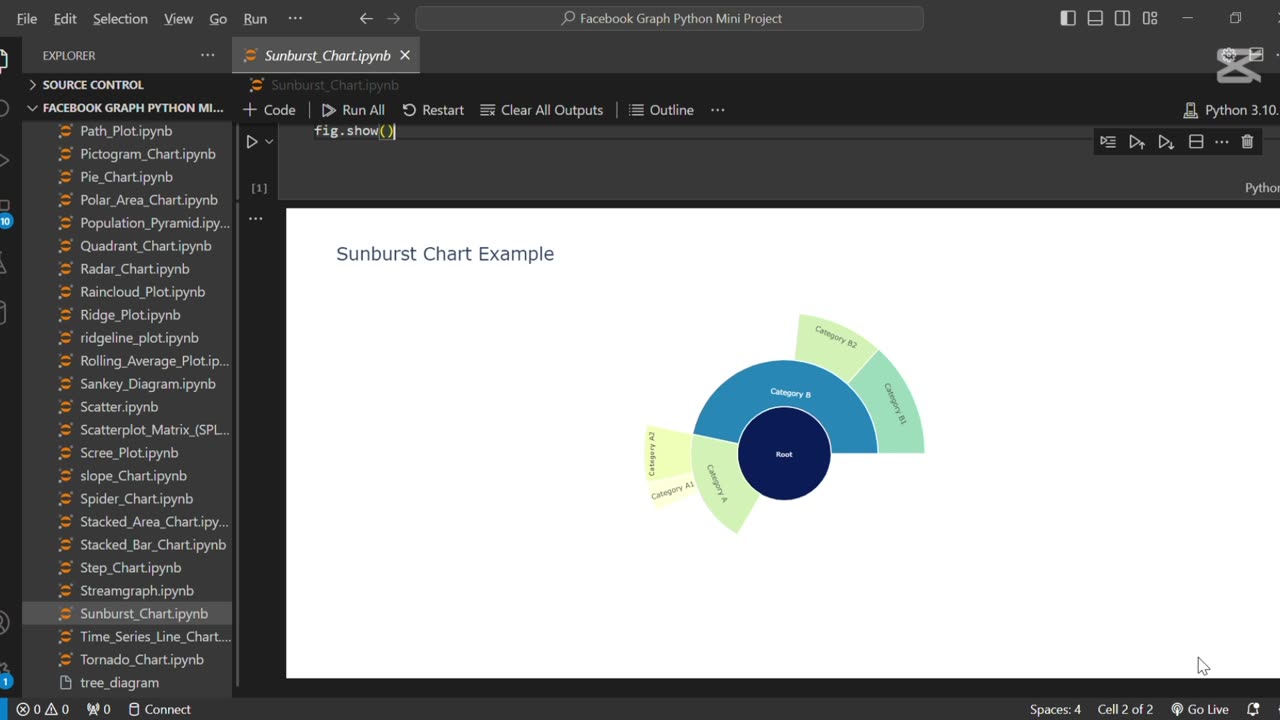
🌞 Create Sunburst Chart Using Python
Loading comments...
-
 0:20
0:20
AI Evolutionary Technology
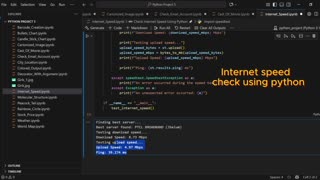
2 months agoUsing Python to Analyze Your Internet Connection
171 -
 LIVE
LIVE
SpartakusLIVE
3 hours agoSOLOS on ARC Raiders || WZ Stream LATER
2,400 watching -
 LIVE
LIVE
Side Scrollers Podcast
5 hours agoSide Scrollers Presents: QUEEN OF THE Wii
456 watching -
 LIVE
LIVE
GritsGG
4 hours agoBO7 Warzone Is Here! Win Streaking! New Leaderboard?
337 watching -
 1:00:55
Jeff Ahern
4 hours ago $6.55 earnedThe Saturday show with Jeff Ahern
37.8K15 -
 LIVE
LIVE
Ouhel
6 hours agoSATURDAY | Battlefield 6 | Going for the Queen in Arc after | O'HELL LIVE |
58 watching -
 LIVE
LIVE
ShivEmUp
4 hours ago🔴LIVE🔴🔵Battlefield 6🔵Game Changing Updates?🔵Grumpy Bird🔵
56 watching -
 LIVE
LIVE
Grant Cardone
6 hours agoHow to Find Your First $1million Profit In Real Estate
968 watching -
![[ FF7 Remake] | Cloud doing what he does best [ PART 6 ]](https://1a-1791.com/video/fwe2/a6/s8/1/Y/8/Y/F/Y8YFz.0kob.1-small--FF7-Remake-Cloud-doing-wha.jpg) 5:00:59
5:00:59
CHiLi XDD
5 hours ago[ FF7 Remake] | Cloud doing what he does best [ PART 6 ]
144 -
![Mr & Mrs X - [DS] Pushing Division, Traitors Will Be Exposed, Hold The Line - EP 18](https://1a-1791.com/video/fwe2/96/s8/1/w/U/W/F/wUWFz.0kob-small-Mr-and-Mrs-X-DS-Pushing-Div.jpg) 54:40
54:40
X22 Report
8 hours agoMr & Mrs X - [DS] Pushing Division, Traitors Will Be Exposed, Hold The Line - EP 18
118K40