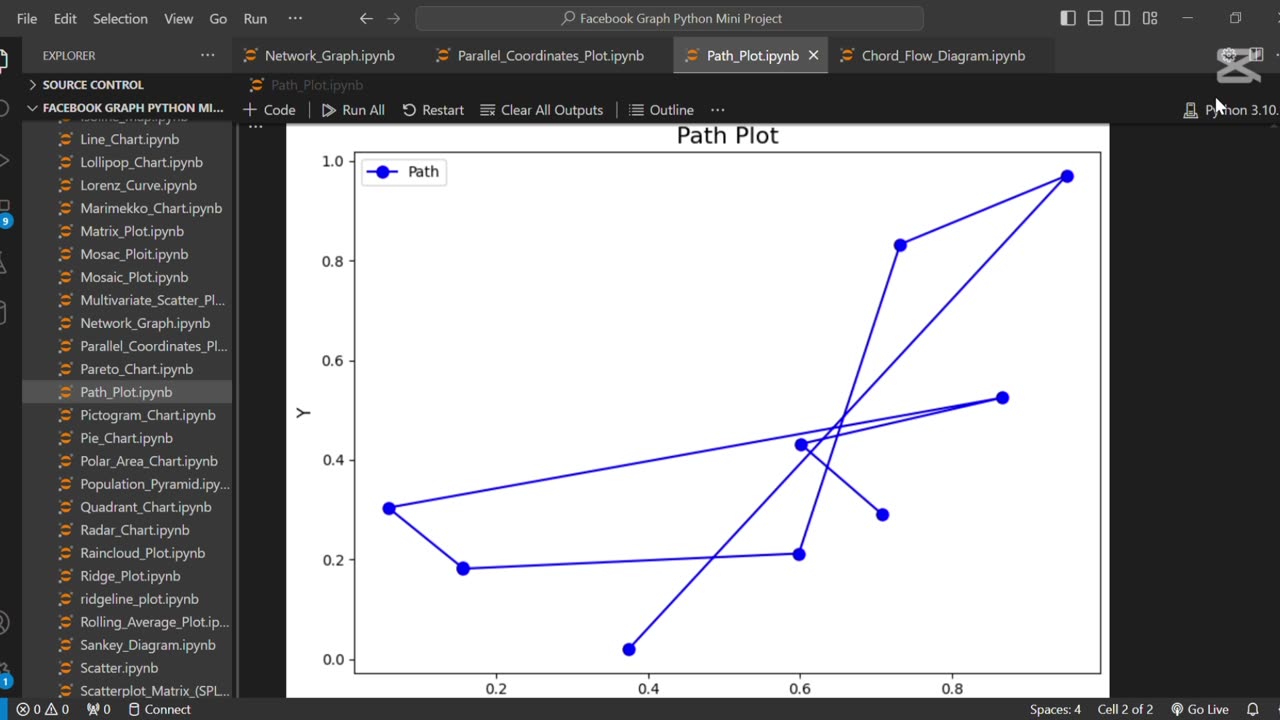
🛤️ Create Path Plot Using Python
3 months ago
The line **"🛤️ Create Path Plot Using Python"** refers to visualizing a sequence of points or movements, often used to represent trajectories or routes over time. Python libraries like Matplotlib or Plotly are commonly used to create path plots for analyzing movement patterns, such as GPS tracks or simulation paths.
Loading comments...
-
 0:36
0:36
AI Evolutionary Technology
3 days agoCreate Empty Recycle Bin with Python
11 -
 1:01:50
VINCE
2 hours agoEpstein Victims Have Come Forth, The Names Have Not | Episode 118 - 09/04/25
59.8K39 -
 LIVE
LIVE
LFA TV
4 hours agoLFA TV ALL DAY STREAM - THURSDAY 9/4/25
4,704 watching -
 LIVE
LIVE
Badlands Media
6 hours agoBadlands Daily: September 4, 2025
3,986 watching -

Dear America
2 hours agoEpstein Victims Vow To EXPOSE Everyone! + Are China and Russia Planning Against Trump?!
88.2K46 -
 LIVE
LIVE
Law&Crime
2 hours ago $1.06 earnedLIVE: Adelson Matriarch Murder Trial — FL v. Donna Adelson — Day 9
277 watching -
 LIVE
LIVE
The Big Mig™
1 hour agoCartels Are On Borrowed Time, Here Comes The BOOM!
4,915 watching -
 LIVE
LIVE
Matt Kohrs
12 hours agoMASSIVE Market Swings Incoming! || Top Futures & Options Trading Show
511 watching -
 LIVE
LIVE
Wendy Bell Radio
6 hours agoIt's All About the Benjamins
7,001 watching -
 LIVE
LIVE
JuicyJohns
2 hours ago $2.89 earned🟢#1 REBIRTH PLAYER 10.2+ KD🟢
91 watching