🛤️ Create Path Plot Using Python
5 months ago
1
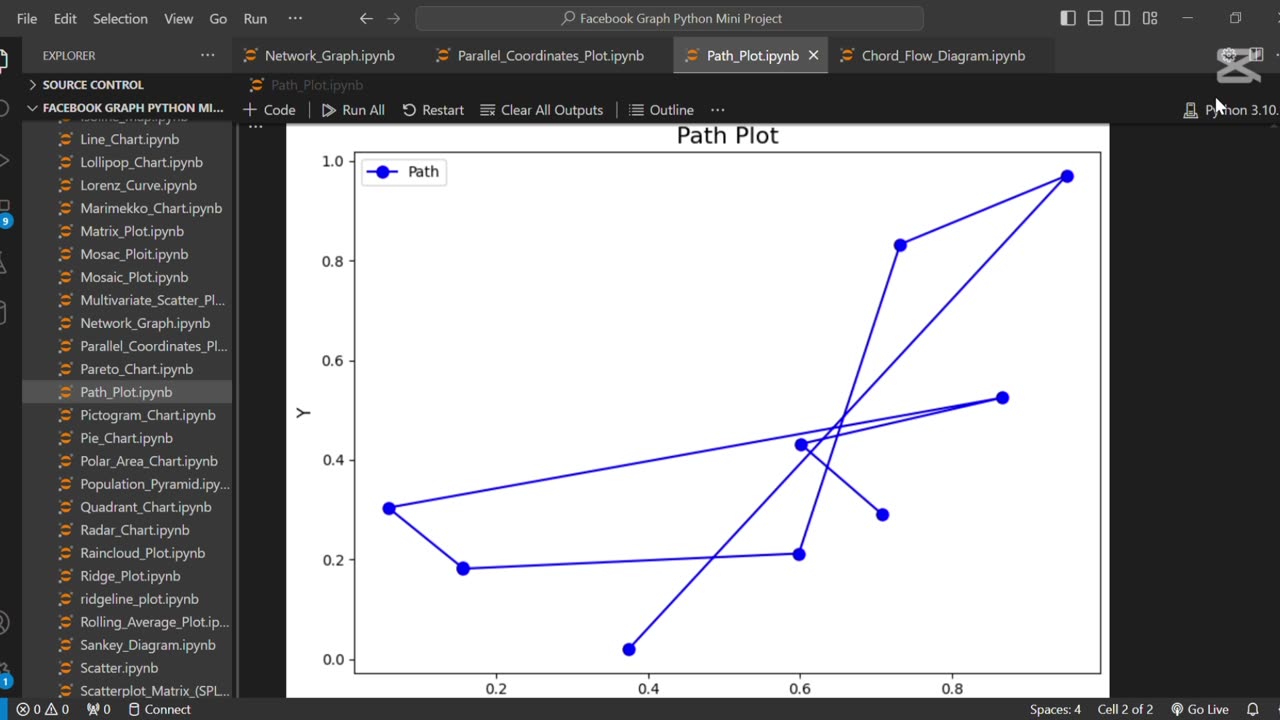
The line **"🛤️ Create Path Plot Using Python"** refers to visualizing a sequence of points or movements, often used to represent trajectories or routes over time. Python libraries like Matplotlib or Plotly are commonly used to create path plots for analyzing movement patterns, such as GPS tracks or simulation paths.
Loading comments...
-
 0:18
0:18
AI Evolutionary Technology
1 month ago💰 Simple Currency Converter App in Python
20 -
 LIVE
LIVE
Steven Crowder
3 hours ago🔴Failed Hit Job: Another Trump Media Hoax Exposed
22,337 watching -
 56:36
56:36
The Rubin Report
2 hours agoFox Hosts Stunned by Piers Morgan’s Dark Prediction for NYC Under Zohran Mamdan
13.5K15 -
![GRAY ZONE DEVLOG FOR .3.5 UPDATE!!! [RGMT CONTENT Mgr. | RGMT GL | GZW CL]](https://1a-1791.com/video/fww1/11/s8/1/0/K/B/w/0KBwz.0kob-small-GRAY-ZONE-DEVLOG-FOR-.3.5-U.jpg) LIVE
LIVE
XDDX_HiTower
33 minutes agoGRAY ZONE DEVLOG FOR .3.5 UPDATE!!! [RGMT CONTENT Mgr. | RGMT GL | GZW CL]
55 watching -
 LIVE
LIVE
LFA TV
15 hours agoLIVE & BREAKING NEWS! | TUESDAY 11/4/25
3,962 watching -
 LIVE
LIVE
The Shannon Joy Show
1 hour agoICE Brutality In Evanston, Illinois Sparks New Outrage * GOP Seeks New FISA Re-Authorization * Are Tucker Carlson & Nick Fuentes Feds?
243 watching -
 LIVE
LIVE
The Mel K Show
1 hour agoA Republic if You Can Keep It-Americans Must Choose 11-04-25
541 watching -
 LIVE
LIVE
Grant Stinchfield
1 hour agoThe Mind Meltdown: Are COVID Shots Fueling America’s Cognitive Collapse?
146 watching -
 1:00:46
VINCE
4 hours agoThe Proof Is In The Emails | Episode 161 - 11/04/25
146K115 -
 2:12:22
Benny Johnson
3 hours ago🚨Trump Releases ALL Evidence Against James Comey in Nuclear Legal BOMBSHELL! It's DARK, US in SHOCK
77.7K26