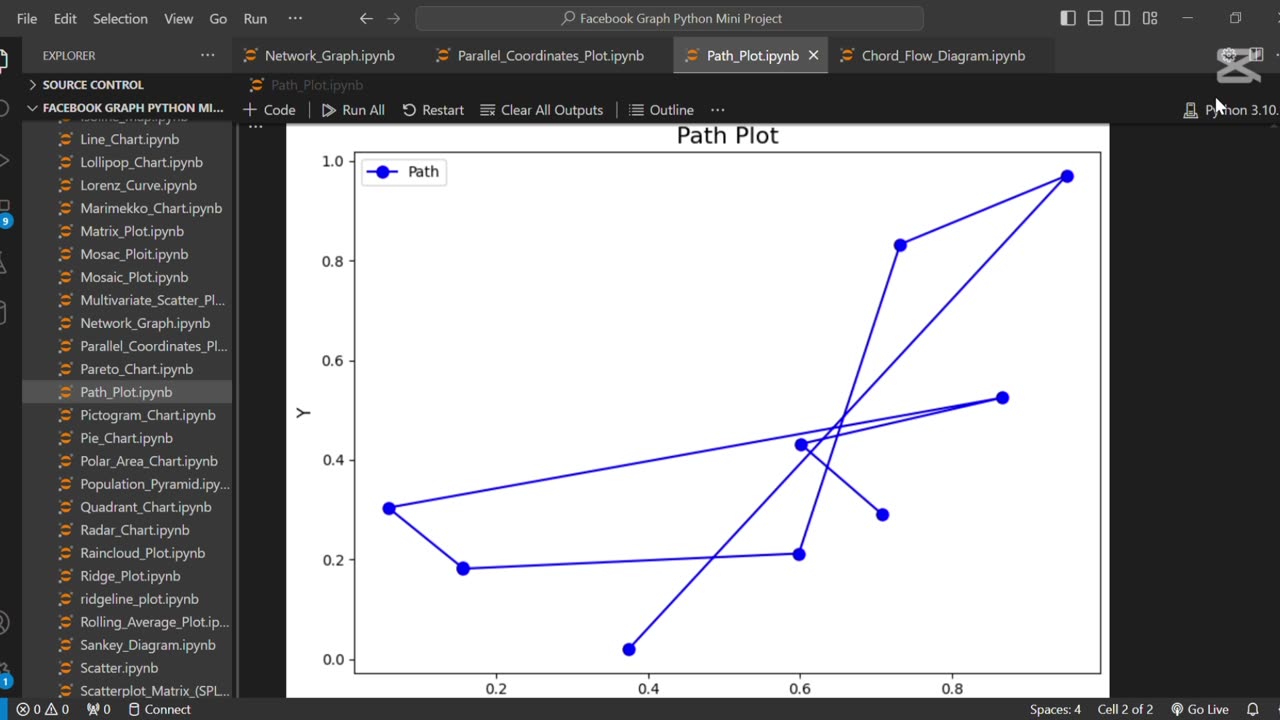
🛤️ Create Path Plot Using Python
5 months ago
3
The line **"🛤️ Create Path Plot Using Python"** refers to visualizing a sequence of points or movements, often used to represent trajectories or routes over time. Python libraries like Matplotlib or Plotly are commonly used to create path plots for analyzing movement patterns, such as GPS tracks or simulation paths.
Loading comments...
-
 0:16
0:16
AI Evolutionary Technology
1 month agoCreate Email Check Account Services Using Python
9 -
 15:04
15:04
MetatronGaming
1 day agoOriginal Commodore 64 VS C64 Maxi - Review and Comparison
1.14K -
 9:46
9:46
MattMorseTV
10 hours ago $7.75 earnedTrump just SHUT DOWN a $287,000,000 FRAUD RING.
7.72K54 -
 15:48
15:48
GritsGG
12 hours agoWinning a Rare Solos Prison End Game on Warzone!
1.45K -
 11:37
11:37
The Pascal Show
12 hours agoTHEY WANT TO END HER?! Candace Owens Claims French President & First Lady Put A H*t Out On Her?!
1.57K1 -
 LIVE
LIVE
Lofi Girl
2 years agoSynthwave Radio 🌌 - beats to chill/game to
248 watching -
 24:30
24:30
DeVory Darkins
13 hours agoMarjorie Taylor Greene RESIGNS as Minnesota dealt MAJOR BLOW after fraud scheme exposed
66.5K111 -
 2:19:48
Badlands Media
1 day agoDevolution Power Hour Ep. 409: Panic in the Narrative — Epstein, Israel, and the Manufactured Meltdowns
156K40 -
 1:52:38
Man in America
10 hours agoCommunists VS Zionists & the Collapse of the American Empire w/ Michael Yon
65.3K26 -
 4:09:34
Akademiks
5 hours agoSheck Wes exposes Fake Industry. Future Not supportin his mans? D4VD had help w disposing his ex?
39.6K3