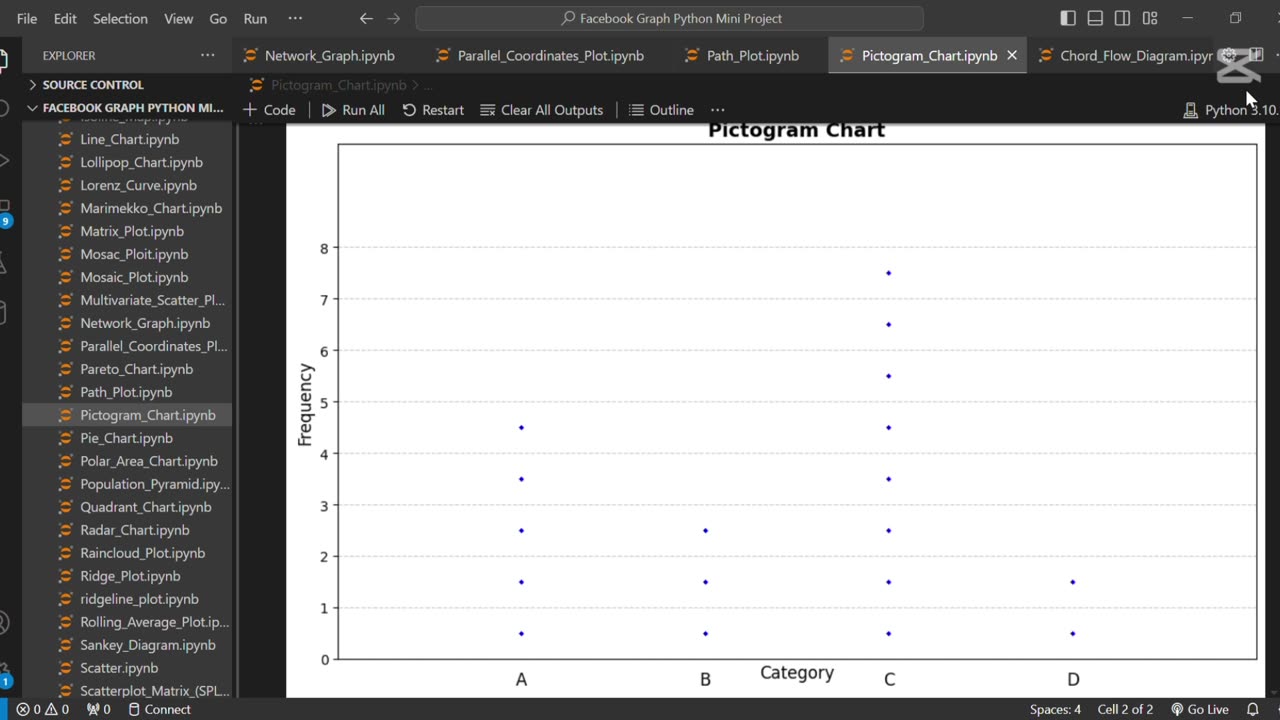
🖼️ Create Pictogram Chart Using Python
3 months ago
1
The line **"🖼️ Create Pictogram Chart Using Python"** refers to creating a visual representation of data using icons or images to depict quantities. Python libraries like Plotly or Matplotlib, combined with image processing tools, can be used to build these charts for engaging and easy-to-understand presentations of statistical data.
Loading comments...
-
 0:52
0:52
AI Evolutionary Technology
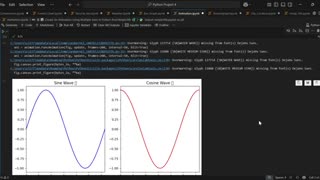
7 days agoCreate Synchronized Multi-Plot Animations in Python
91 -
 LIVE
LIVE
The Rubin Report
50 minutes agoPress Stunned by Trump’s Brutally Honest Message for Elon Musk
1,540 watching -
 1:01:50
VINCE
2 hours agoEpstein Victims Have Come Forth, The Names Have Not | Episode 118 - 09/04/25
59.8K39 -
 LIVE
LIVE
LFA TV
4 hours agoLFA TV ALL DAY STREAM - THURSDAY 9/4/25
4,704 watching -
 LIVE
LIVE
Badlands Media
6 hours agoBadlands Daily: September 4, 2025
3,986 watching -

Dear America
2 hours agoEpstein Victims Vow To EXPOSE Everyone! + Are China and Russia Planning Against Trump?!
88.2K46 -
 LIVE
LIVE
Law&Crime
2 hours ago $1.06 earnedLIVE: Adelson Matriarch Murder Trial — FL v. Donna Adelson — Day 9
277 watching -
 LIVE
LIVE
The Big Mig™
1 hour agoCartels Are On Borrowed Time, Here Comes The BOOM!
4,915 watching -
 LIVE
LIVE
Matt Kohrs
12 hours agoMASSIVE Market Swings Incoming! || Top Futures & Options Trading Show
511 watching -
 LIVE
LIVE
Wendy Bell Radio
6 hours agoIt's All About the Benjamins
7,001 watching