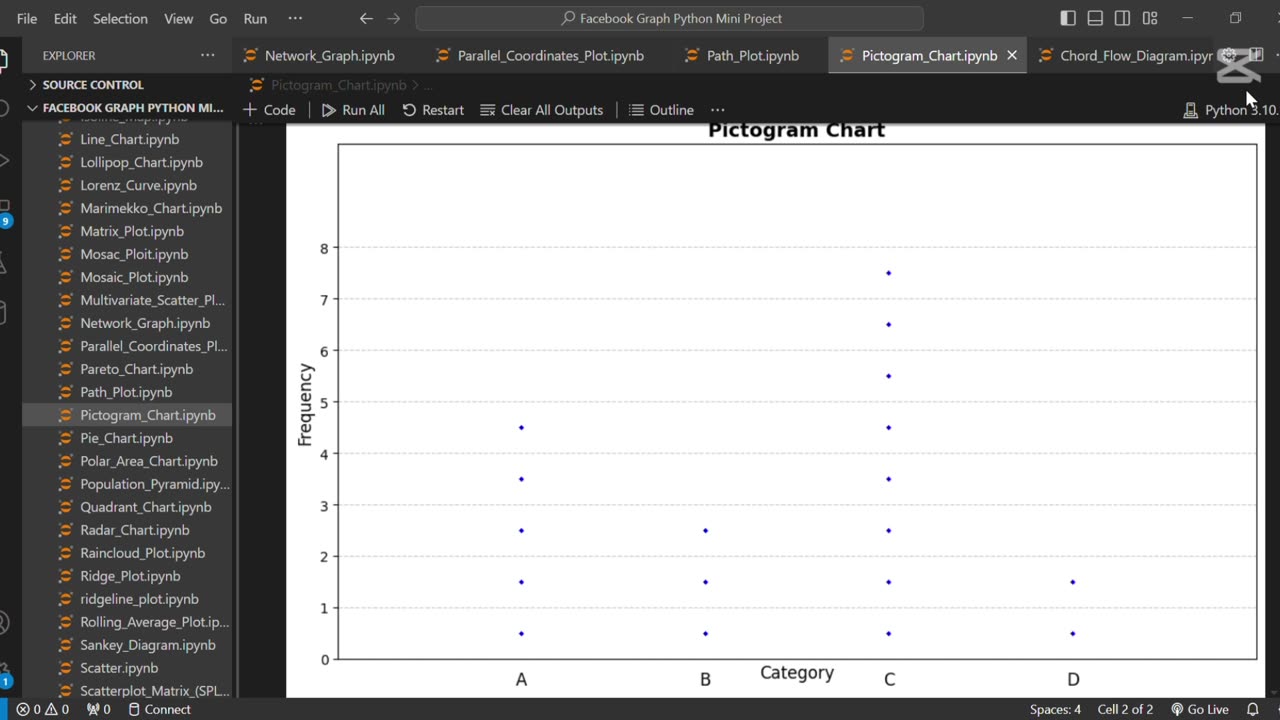
🖼️ Create Pictogram Chart Using Python
5 months ago
5
The line **"🖼️ Create Pictogram Chart Using Python"** refers to creating a visual representation of data using icons or images to depict quantities. Python libraries like Plotly or Matplotlib, combined with image processing tools, can be used to build these charts for engaging and easy-to-understand presentations of statistical data.
Loading comments...
-
 0:17
0:17
AI Evolutionary Technology
2 months agoVisualizing Molecular Structure From SMILES Using RDKit 🧪
5 -

Man in America
7 hours agoCommunists VS Zionists & the Collapse of the American Empire w/ Michael Yon
46.6K11 -
 LIVE
LIVE
Akademiks
2 hours agoSheck Wes exposes Fake Industry. Future Not supportin his mans? D4VD had help w disposing his ex?
1,425 watching -

SpartakusLIVE
6 hours agoTeam BUNGULATORS || From HUGE WZ DUBS to TOXIC ARC BETRAYALS
97.6K2 -
 LIVE
LIVE
BlackDiamondGunsandGear
2 hours agoAre You that guy? / Carrying a Pocket Pistol /After Hours Armory
331 watching -
 LIVE
LIVE
Camhigby
3 hours agoLIVE - Riot Watch Portland, DC, NC
217 watching -
 2:54:58
CAMELOT331
5 hours agoYouTube Just Told Me I OWE THOUSANDS $ TO THEM... update
20.2K2 -
 2:00:53
Tundra Tactical
12 hours ago $0.89 earned🛑LIVE AT 9PM CST!! Your Government Hates Your Guns : DOJ Holds Firm On National FIREARMS ACT
13.3K -
 LIVE
LIVE
DLDAfterDark
3 hours ago $1.16 earnedAre YOU The Guy That Ruins Thanksgiving?? - God Guns & Gear
309 watching -
 2:58:31
NewsTreason
4 hours agoDECLAS w/ Rambo & Dave: Nuremberg 2.0 | MTG Exits Stage Left | Mamdani Psyop Confirmed, 8pm EST
61.8K59