🖼️ Create Pictogram Chart Using Python
5 months ago
5
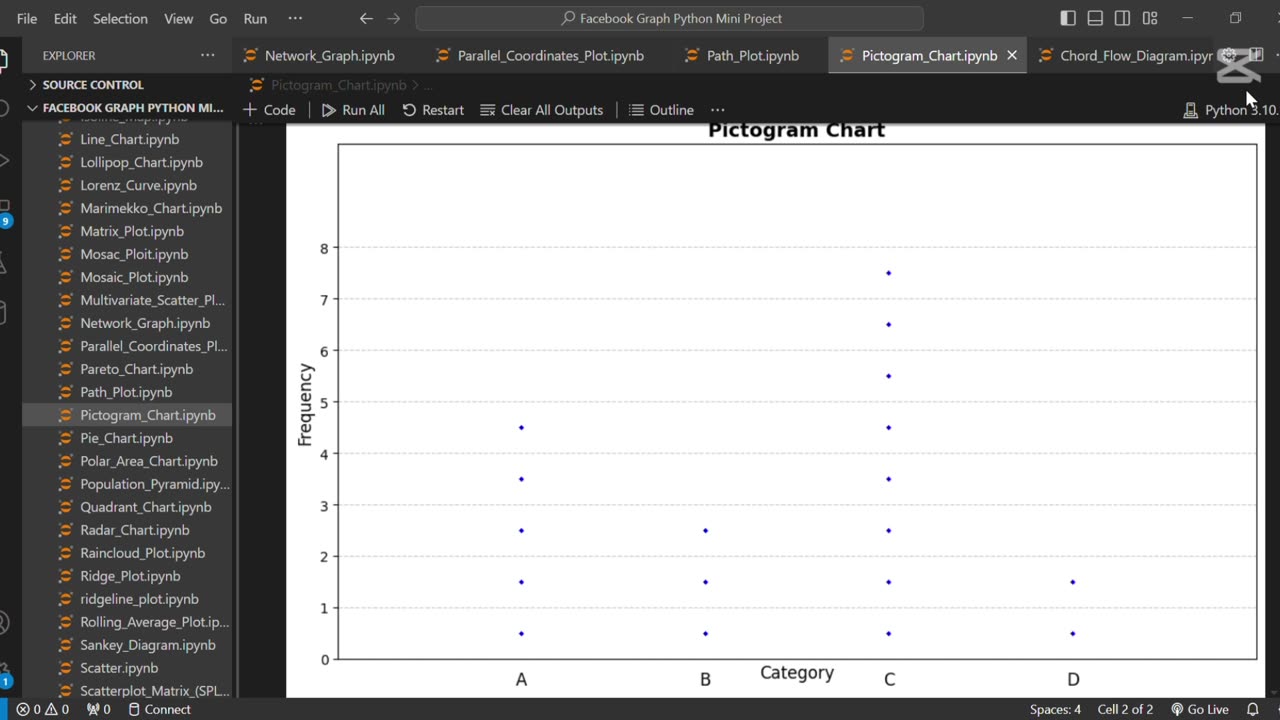
The line **"🖼️ Create Pictogram Chart Using Python"** refers to creating a visual representation of data using icons or images to depict quantities. Python libraries like Plotly or Matplotlib, combined with image processing tools, can be used to build these charts for engaging and easy-to-understand presentations of statistical data.
Loading comments...
-
 0:17
0:17
AI Evolutionary Technology
2 months agoVisualizing Molecular Structure From SMILES Using RDKit 🧪
5 -
 46:39
46:39
The Bold Lib
1 day agoOwen Shroyer: BOLDTALK W/Angela Belcamino
53310 -
 7:57
7:57
Blackstone Griddles
1 day agoDouble Barrel Sausage Sandwich | Blackstone Griddles
7031 -
 32:24
32:24
Forrest Galante
10 hours agoHunting and Eating The World's WORST Fish (Everglades At Night)
88.5K4 -
 32:10
32:10
Nikko Ortiz
15 hours agoSecret Agent Infiltrates Neo-Nazis...
9.05K12 -
 15:04
15:04
MetatronGaming
1 day agoOriginal Commodore 64 VS C64 Maxi - Review and Comparison
18.2K7 -
 9:46
9:46
MattMorseTV
13 hours ago $16.18 earnedTrump just SHUT DOWN a $287,000,000 FRAUD RING.
17.9K77 -
 15:48
15:48
GritsGG
15 hours agoWinning a Rare Solos Prison End Game on Warzone!
13.3K1 -
 11:37
11:37
The Pascal Show
15 hours ago $3.68 earnedTHEY WANT TO END HER?! Candace Owens Claims French President & First Lady Put A H*t Out On Her?!
11.7K13 -
 LIVE
LIVE
Lofi Girl
2 years agoSynthwave Radio 🌌 - beats to chill/game to
455 watching