🖼️ Create Pictogram Chart Using Python
6 months ago
5
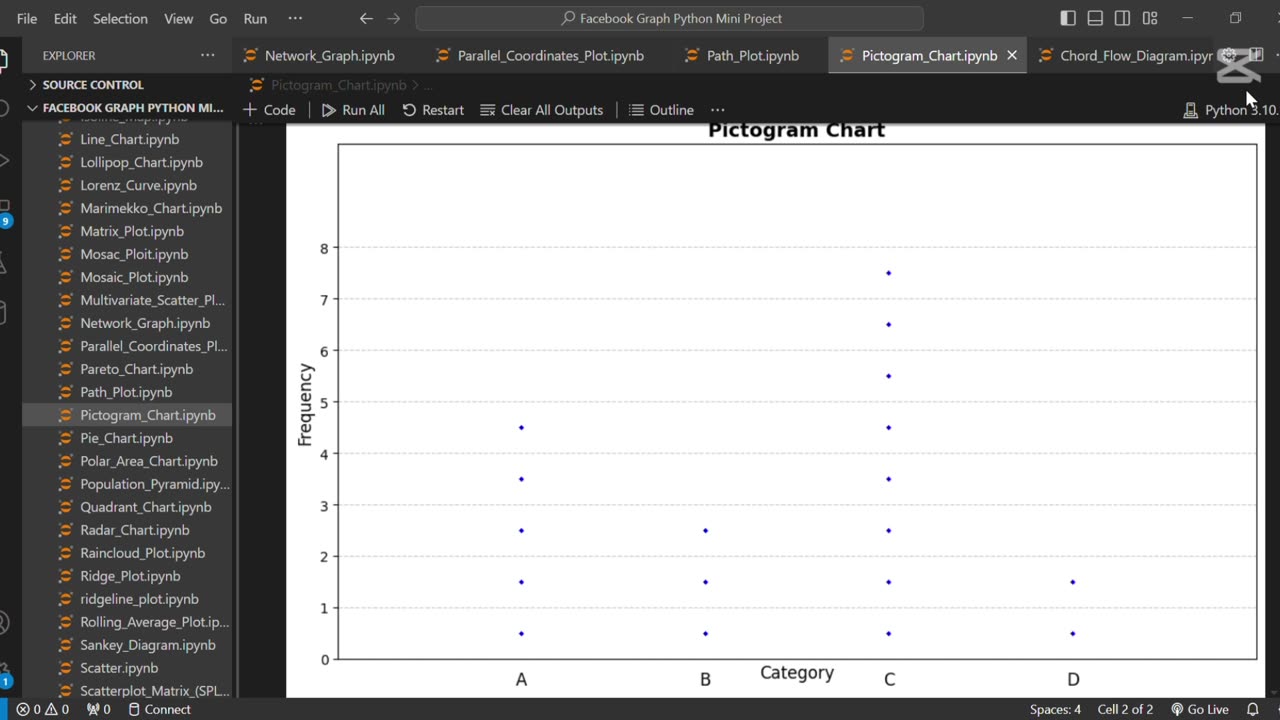
The line **"🖼️ Create Pictogram Chart Using Python"** refers to creating a visual representation of data using icons or images to depict quantities. Python libraries like Plotly or Matplotlib, combined with image processing tools, can be used to build these charts for engaging and easy-to-understand presentations of statistical data.
Loading comments...
-
 0:16
0:16
AI Evolutionary Technology
2 months agoCreate Email Check Account Services Using Python
9 -
 20:08
20:08
MYLUNCHBREAK CHANNEL PAGE
6 hours agoThe Field Museum is From Another Timeline
3.13K2 -
 LIVE
LIVE
SpartakusLIVE
3 hours agoSOLOS on ARC Raiders || WZ Stream LATER
2,400 watching -
 LIVE
LIVE
Side Scrollers Podcast
5 hours agoSide Scrollers Presents: QUEEN OF THE Wii
456 watching -
 LIVE
LIVE
GritsGG
4 hours agoBO7 Warzone Is Here! Win Streaking! New Leaderboard?
337 watching -
 1:00:55
Jeff Ahern
4 hours ago $6.55 earnedThe Saturday show with Jeff Ahern
37.8K15 -
 LIVE
LIVE
Ouhel
6 hours agoSATURDAY | Battlefield 6 | Going for the Queen in Arc after | O'HELL LIVE |
58 watching -
 LIVE
LIVE
ShivEmUp
4 hours ago🔴LIVE🔴🔵Battlefield 6🔵Game Changing Updates?🔵Grumpy Bird🔵
56 watching -
 LIVE
LIVE
Grant Cardone
6 hours agoHow to Find Your First $1million Profit In Real Estate
968 watching -
![[ FF7 Remake] | Cloud doing what he does best [ PART 6 ]](https://1a-1791.com/video/fwe2/a6/s8/1/Y/8/Y/F/Y8YFz.0kob.1-small--FF7-Remake-Cloud-doing-wha.jpg) 5:00:59
5:00:59
CHiLi XDD
5 hours ago[ FF7 Remake] | Cloud doing what he does best [ PART 6 ]
144