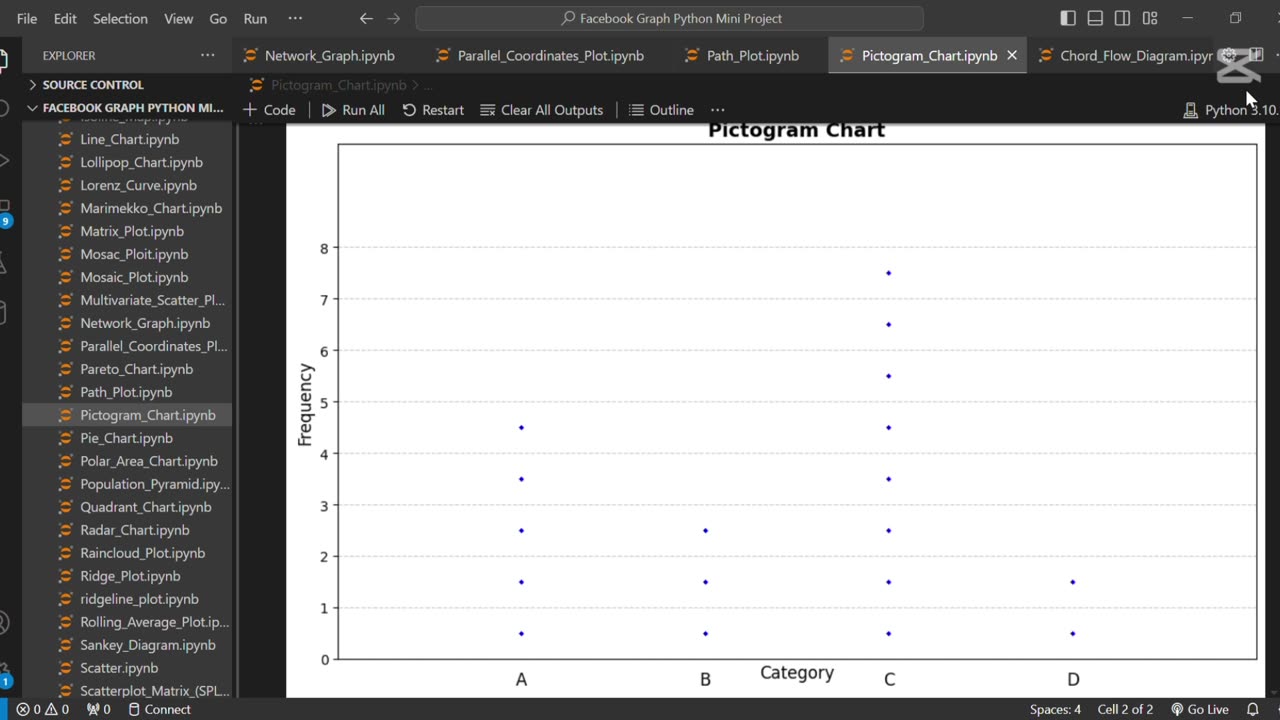
🖼️ Create Pictogram Chart Using Python
5 months ago
3
The line **"🖼️ Create Pictogram Chart Using Python"** refers to creating a visual representation of data using icons or images to depict quantities. Python libraries like Plotly or Matplotlib, combined with image processing tools, can be used to build these charts for engaging and easy-to-understand presentations of statistical data.
Loading comments...
-
 0:18
0:18
AI Evolutionary Technology
1 month ago💰 Simple Currency Converter App in Python
20 -
 LIVE
LIVE
Chad Prather
12 hours agoQuit Fighting: Real Strength Starts Here!
8,376 watching -
 LIVE
LIVE
LFA TV
11 hours agoLIVE & BREAKING NEWS! | TUESDAY 11/4/25
6,392 watching -
 LIVE
LIVE
The Bubba Army
22 hours agoIS FETTERMAN GOING REPUBLICAN? - Bubba the Love Sponge® Show | 11/04/25
3,019 watching -
 LIVE
LIVE
BEK TV
23 hours agoTrent Loos in the Morning - 11/04/2025
194 watching -
 21:38
21:38
Professor Nez
20 hours agoTrump JUST BROKE the INTERNET with SAVAGE Line on Ilhan Omar!
42.3K58 -
 1:17:52
Dialogue works
3 days ago $10.17 earnedMartin Armstrong: This Is How World War III Starts… And It Already Has
36.4K18 -
 38:16
38:16
daniellesmithab
3 days agoAlberta Update: Getting Kids Back to the Classroom
28.4K11 -
 20:48
20:48
BlaireWhite
5 days agoTrans TikTokers Are Crashing Out (Over Nothing)
32.6K11 -
 2:07:06
Side Scrollers Podcast
22 hours agoHasan Piker CAUGHT LYING AGAIN + Twitch URGES LEFTIST IDEOLOGY + More | Side Scrollers
74.8K11