🖼️ Create Pictogram Chart Using Python
5 months ago
5
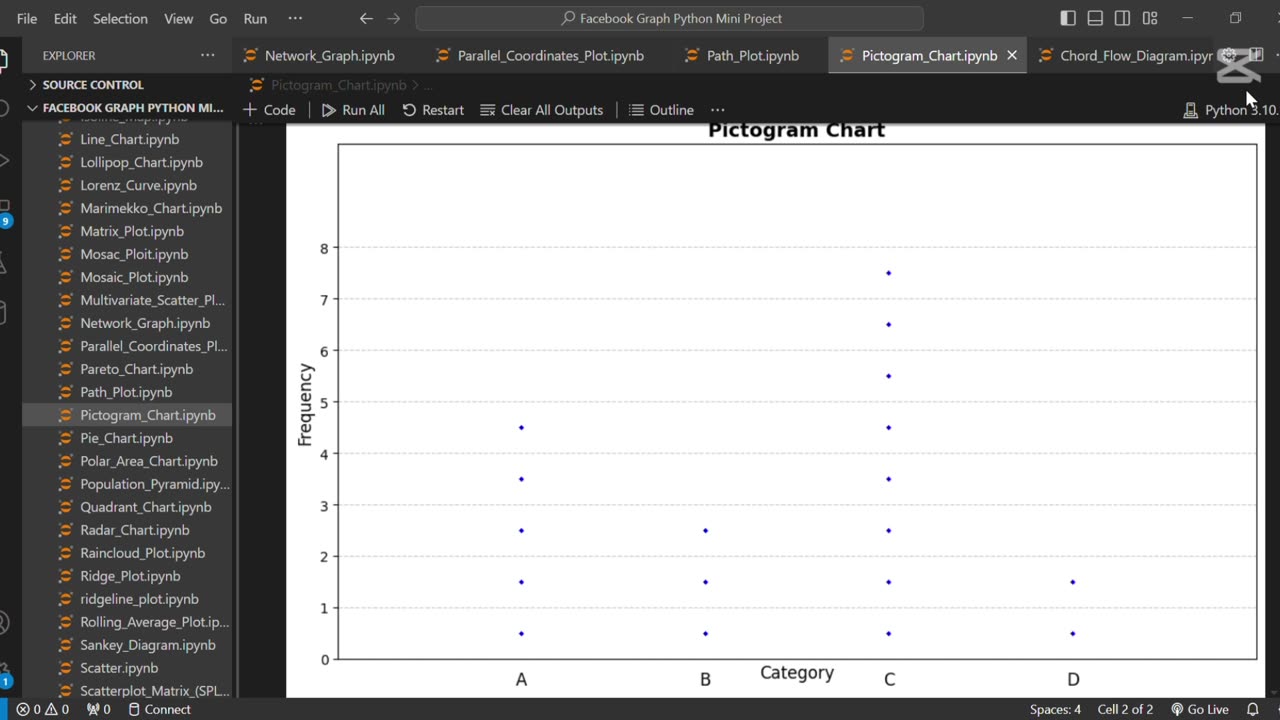
The line **"🖼️ Create Pictogram Chart Using Python"** refers to creating a visual representation of data using icons or images to depict quantities. Python libraries like Plotly or Matplotlib, combined with image processing tools, can be used to build these charts for engaging and easy-to-understand presentations of statistical data.
Loading comments...
-
 0:18
0:18
AI Evolutionary Technology
1 month ago💰 Simple Currency Converter App in Python
32 -
 32:10
32:10
Nikko Ortiz
11 hours agoSecret Agent Infiltrates Neo-Nazis...
8594 -
 15:04
15:04
MetatronGaming
1 day agoOriginal Commodore 64 VS C64 Maxi - Review and Comparison
37 -
 9:46
9:46
MattMorseTV
10 hours ago $7.75 earnedTrump just SHUT DOWN a $287,000,000 FRAUD RING.
6.59K52 -
 15:48
15:48
GritsGG
12 hours agoWinning a Rare Solos Prison End Game on Warzone!
59 -
 11:37
11:37
The Pascal Show
12 hours agoTHEY WANT TO END HER?! Candace Owens Claims French President & First Lady Put A H*t Out On Her?!
791 -
 LIVE
LIVE
Lofi Girl
2 years agoSynthwave Radio 🌌 - beats to chill/game to
253 watching -
 24:30
24:30
DeVory Darkins
13 hours agoMarjorie Taylor Greene RESIGNS as Minnesota dealt MAJOR BLOW after fraud scheme exposed
43.2K111 -
 2:19:48
Badlands Media
1 day agoDevolution Power Hour Ep. 409: Panic in the Narrative — Epstein, Israel, and the Manufactured Meltdowns
152K40 -
 1:52:38
Man in America
10 hours agoCommunists VS Zionists & the Collapse of the American Empire w/ Michael Yon
59K25