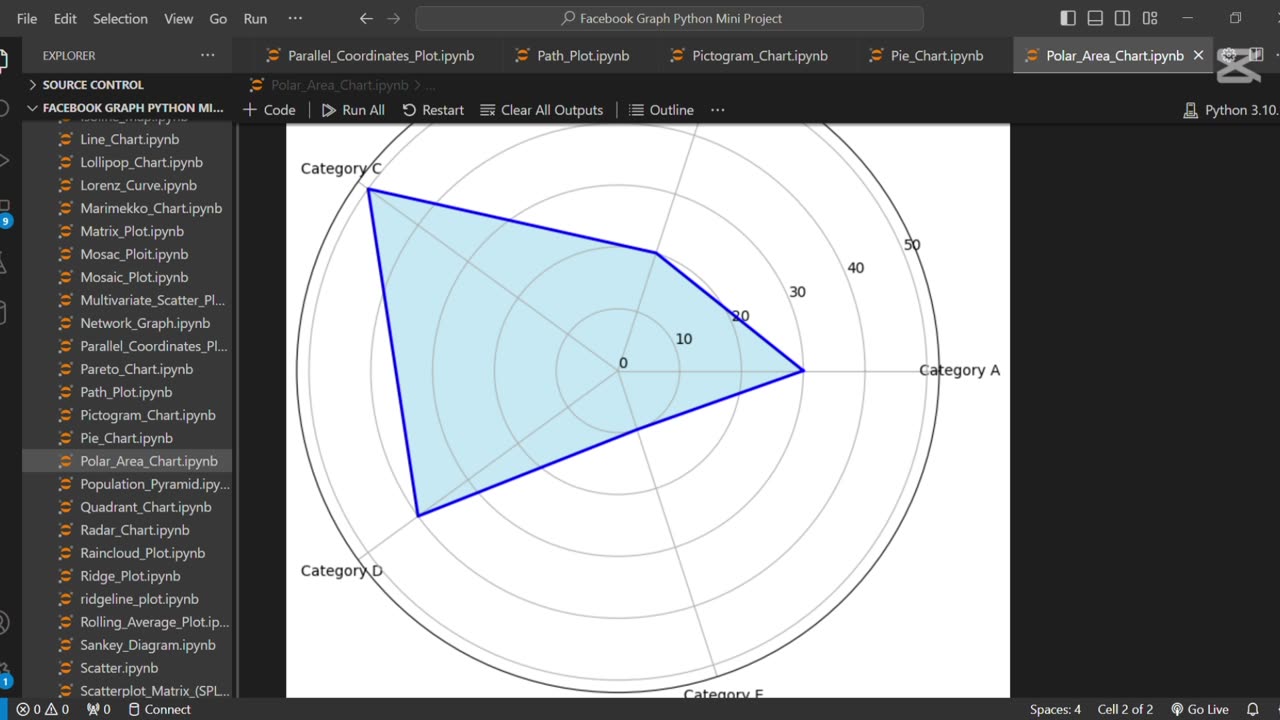
🔵 Create Polar Area Chart Using Python
3 months ago
The line "🔵 Create Polar Area Chart Using Python" refers to generating a circular chart where data is displayed in segments around a polar axis, with each segment's radius representing a value. Python libraries like Matplotlib are used to create these charts for visualizing cyclical data such as seasons, time, or directions.
Loading comments...
-
 0:39
0:39
AI Evolutionary Technology
5 days agoHow to Create a Streamgraph in Python
1 -
 56:27
56:27
Sarah Westall
5 hours agoEnd of Aging, Hydrogen Bomb Research, Serial Killers & Violent Behavior, Bipolar Research w/Dr Walsh
23.5K2 -
 4:36:53
MattMorseTV
6 hours ago $0.46 earned🔴Sunday Gaming🔴
49.2K2 -
 2:31:16
Joker Effect
2 hours agoINTERVIEWING Rumble Gaming community members: Viewbotting and how they see the current landscape.
13.1K2 -
 1:45:53
Nerdrotic
6 hours ago $0.27 earnedUnravelling the Secrets of Skinwalker Ranch | Forbidden Frontier #115
71.8K4 -
 41:56
41:56
Athlete & Artist Show
6 hours ago $0.75 earnedAustin Ekeler: Going From "0 Star Recruit" To Leading The NFL In TD's, New Fan App | FROM THE VAULT
21.7K1 -
 2:46:49
Barry Cunningham
11 hours agoNOW THEY FEAR US! | RFKJR STRIKES BACK | JD VANCE ON PRESIDENT TRUMP | AND MORE NEWS!
67.2K49 -
 LIVE
LIVE
Spartan
6 hours agoCharlotte Qualifier watch party + Ranked and Expedition 33
116 watching -
 6:09:54
bigbossrobinson
9 hours agoLIVE - DOUBLE IMPACT - RESIDENT EVIL 4 & METAL GEAR SOLID Δ: SNAKE EATER
32K1 -
 14:37
14:37
Colion Noir
11 hours agoCanadian Police Chief Urges Citizens To Comply With Home Invaders And Hide
78.9K94