🔵 Create Polar Area Chart Using Python
5 months ago
1
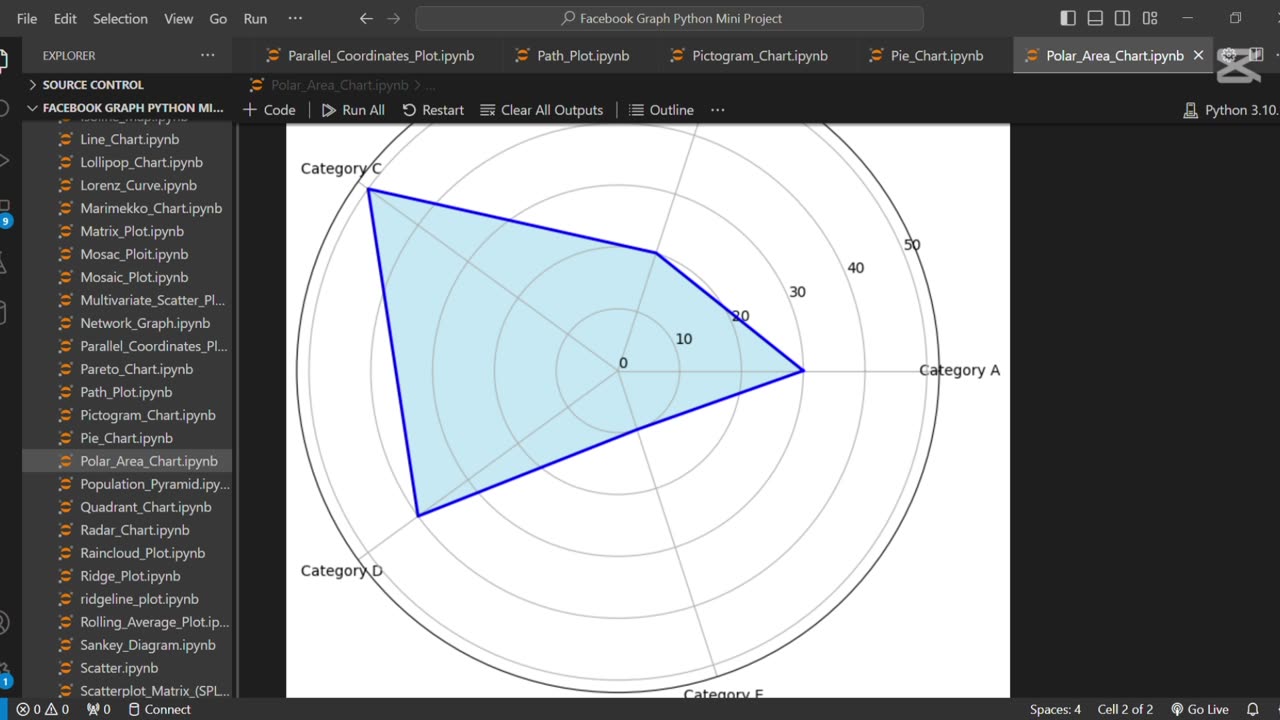
The line "🔵 Create Polar Area Chart Using Python" refers to generating a circular chart where data is displayed in segments around a polar axis, with each segment's radius representing a value. Python libraries like Matplotlib are used to create these charts for visualizing cyclical data such as seasons, time, or directions.
Loading comments...
-
 0:17
0:17
AI Evolutionary Technology
2 months agoVisualizing Molecular Structure From SMILES Using RDKit 🧪
5 -
 LIVE
LIVE
Camhigby
3 hours agoLIVE - Riot Watch Portland, DC, NC
217 watching -
 2:54:58
CAMELOT331
5 hours agoYouTube Just Told Me I OWE THOUSANDS $ TO THEM... update
20.2K2 -
 2:00:53
Tundra Tactical
12 hours ago $0.89 earned🛑LIVE AT 9PM CST!! Your Government Hates Your Guns : DOJ Holds Firm On National FIREARMS ACT
13.3K -
 LIVE
LIVE
DLDAfterDark
3 hours ago $1.16 earnedAre YOU The Guy That Ruins Thanksgiving?? - God Guns & Gear
309 watching -
 2:58:31
NewsTreason
4 hours agoDECLAS w/ Rambo & Dave: Nuremberg 2.0 | MTG Exits Stage Left | Mamdani Psyop Confirmed, 8pm EST
61.8K59 -
 LIVE
LIVE
meleegames
4 hours agoSONG REQUESTS CLOSED - Melee Music - Beat Hazard 3 - Devil Inside
234 watching -
 2:13:31
The Connect: With Johnny Mitchell
11 hours ago $1.62 earnedIs Garth Brooks A Serial Killer? Exposing The Dark Secrets Of Country Music's Biggest Star
10.8K2 -
 1:00:49
MattMorseTV
5 hours ago $79.23 earned🔴Massive VICTORY in the SUPREME COURT.🔴
100K126 -
 LIVE
LIVE
GritsGG
4 hours ago#1 Most Warzone Wins 4015+!
78 watching