🔵 Create Polar Area Chart Using Python
5 months ago
1
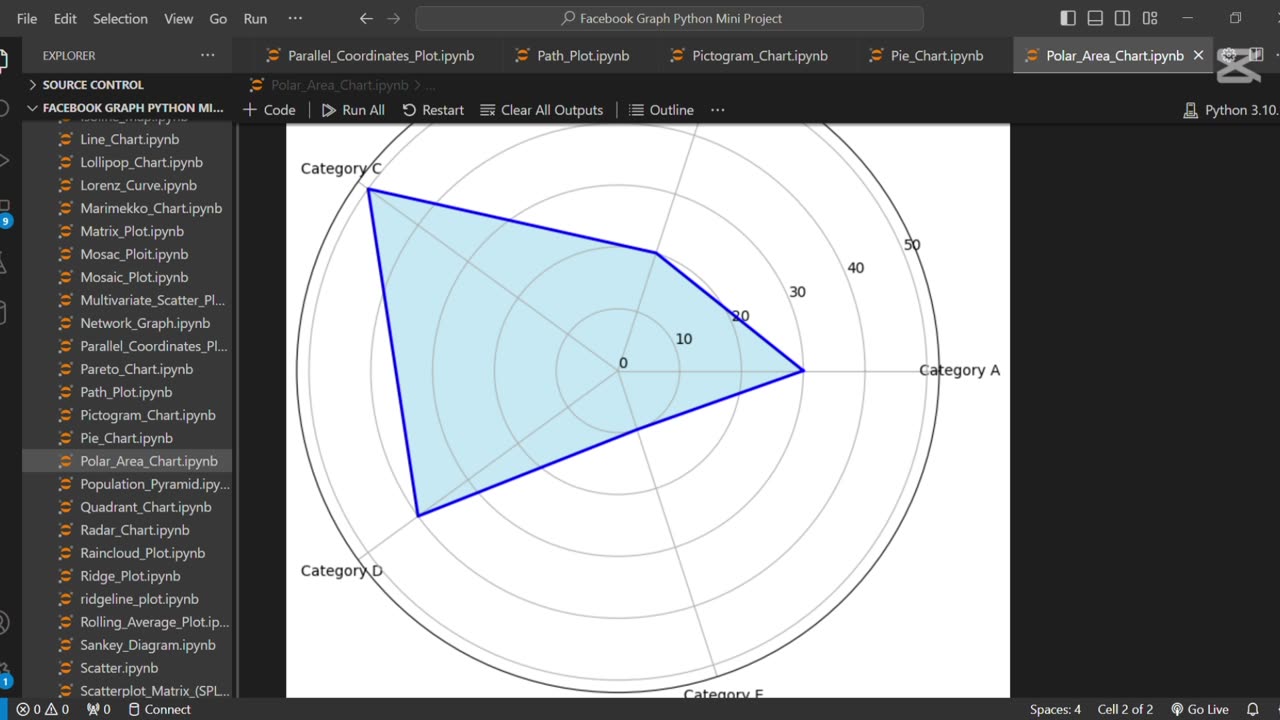
The line "🔵 Create Polar Area Chart Using Python" refers to generating a circular chart where data is displayed in segments around a polar axis, with each segment's radius representing a value. Python libraries like Matplotlib are used to create these charts for visualizing cyclical data such as seasons, time, or directions.
Loading comments...
-
 0:17
0:17
AI Evolutionary Technology
1 month agoVisualizing Molecular Structure From SMILES Using RDKit 🧪
4 -
 16:30
16:30
Clintonjaws
17 hours ago $4.31 earned'The View's' Producer Stops Show & Forces Whoopie To Correct Lie
18.8K6 -
 1:10:24
Steve-O's Wild Ride! Podcast
5 days ago $0.38 earnedMatt McCusker Makes Steve-O Nervous | Wild Ride #272
13.1K1 -
 17:09
17:09
Bearing
9 hours agoHasan Goes NUCLEAR On Chat ☢️ ROASTED By JD Vance Over Dog Allegations 🚨
18.8K28 -
 LIVE
LIVE
The HotSeat With Todd Spears
1 hour agoEP 203: The Military "Whistleblower"
780 watching -
![[Ep 784] Election 2025: NYC is Screwed | Tatum Calls Out Kirk Conspiracists | Guest: Sam Anthony](https://1a-1791.com/video/fwe2/00/s8/1/U/Q/E/w/UQEwz.0kob-small-Ep-784-Election-2025-NYC-is.jpg) LIVE
LIVE
The Nunn Report - w/ Dan Nunn
1 hour ago[Ep 784] Election 2025: NYC is Screwed | Tatum Calls Out Kirk Conspiracists | Guest: Sam Anthony
160 watching -
 1:22:54
DeVory Darkins
4 hours agoTrump makes shocking announcement as Major ELECTION UPDATE drops after bomb threat
91.8K53 -
 10:11
10:11
Dr. Nick Zyrowski
8 days agoDoes Creatine CAUSE Hair Loss? (We All Got This Wrong)
6.85K2 -
 1:09:24
Timcast
4 hours agoZohran Mamdani BLAMES Trump Over Bomb Threats At Polling Locations
169K106 -
 3:09:52
Right Side Broadcasting Network
6 hours agoLIVE REPLAY: White House Press Secretary Karoline Leavitt Holds a Press Briefing - 11/4/25
80K16