👥 Create Population Pyramid Chart Using Python
5 months ago
5
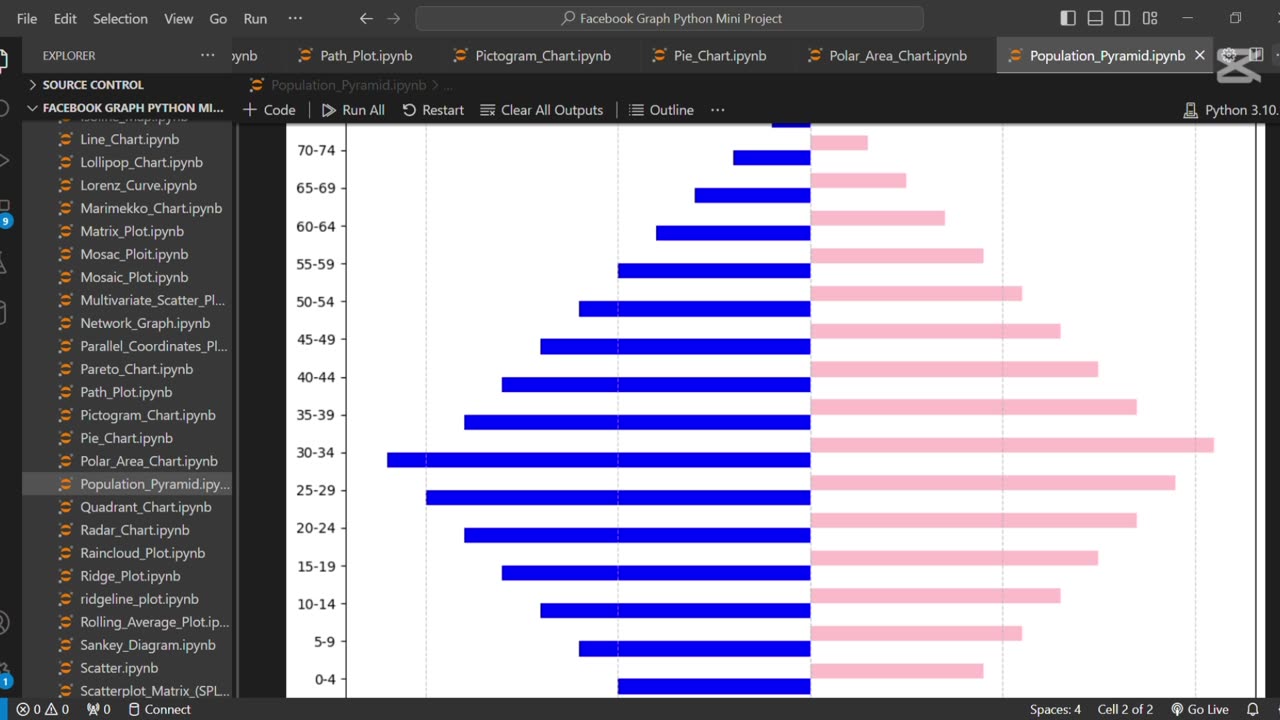
👥 Create Population Pyramid Chart Using Python" refers to visualizing age and gender distribution within a population using a mirrored bar chart. Python libraries like Matplotlib or Seaborn are typically used to create this chart, which is useful for demographic analysis and forecasting.
Loading comments...
-
 0:20
0:20
AI Evolutionary Technology
1 month agoUsing Python to Analyze Your Internet Connection
171 -
 46:39
46:39
The Bold Lib
1 day agoOwen Shroyer: BOLDTALK W/Angela Belcamino
53310 -
 7:57
7:57
Blackstone Griddles
1 day agoDouble Barrel Sausage Sandwich | Blackstone Griddles
7031 -
 32:24
32:24
Forrest Galante
10 hours agoHunting and Eating The World's WORST Fish (Everglades At Night)
88.5K4 -
 32:10
32:10
Nikko Ortiz
15 hours agoSecret Agent Infiltrates Neo-Nazis...
9.05K12 -
 15:04
15:04
MetatronGaming
1 day agoOriginal Commodore 64 VS C64 Maxi - Review and Comparison
18.2K7 -
 9:46
9:46
MattMorseTV
13 hours ago $16.18 earnedTrump just SHUT DOWN a $287,000,000 FRAUD RING.
17.9K77 -
 15:48
15:48
GritsGG
15 hours agoWinning a Rare Solos Prison End Game on Warzone!
13.3K1 -
 11:37
11:37
The Pascal Show
15 hours ago $3.68 earnedTHEY WANT TO END HER?! Candace Owens Claims French President & First Lady Put A H*t Out On Her?!
11.7K13 -
 LIVE
LIVE
Lofi Girl
2 years agoSynthwave Radio 🌌 - beats to chill/game to
455 watching