👥 Create Population Pyramid Chart Using Python
5 months ago
5
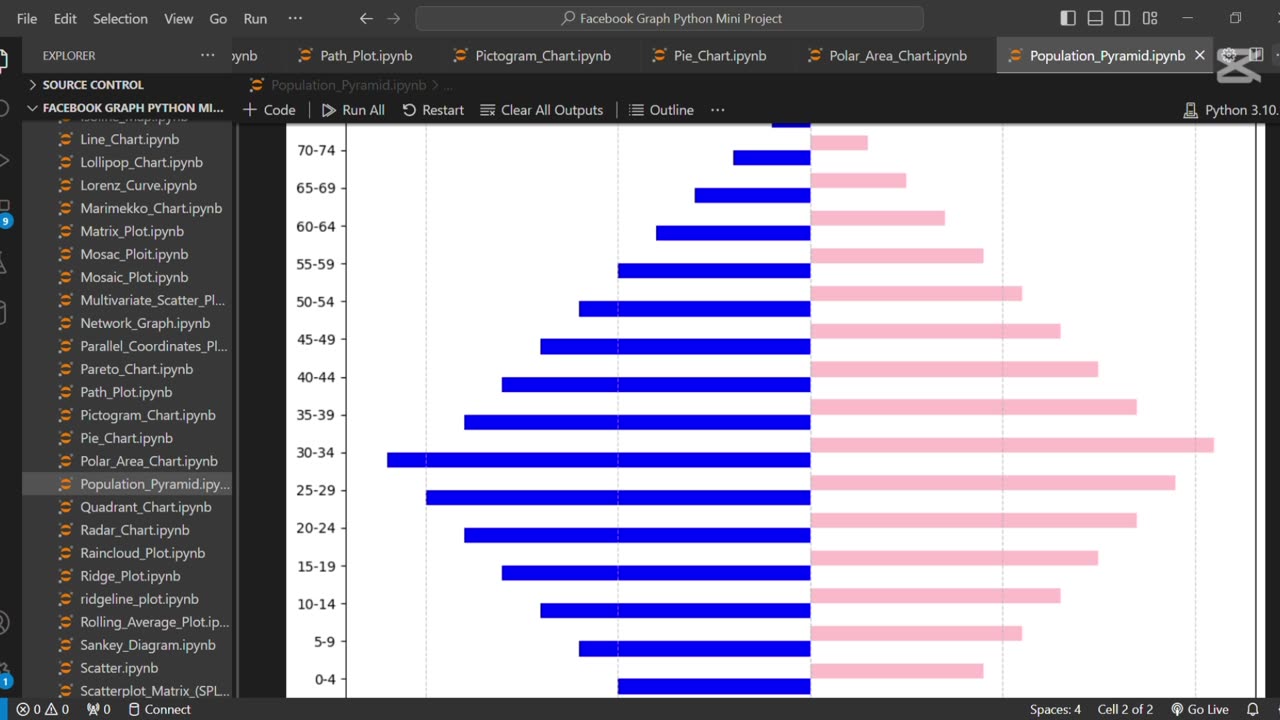
👥 Create Population Pyramid Chart Using Python" refers to visualizing age and gender distribution within a population using a mirrored bar chart. Python libraries like Matplotlib or Seaborn are typically used to create this chart, which is useful for demographic analysis and forecasting.
Loading comments...
-
 0:18
0:18
AI Evolutionary Technology
1 month ago💰 Simple Currency Converter App in Python
32 -
 32:10
32:10
Nikko Ortiz
11 hours agoSecret Agent Infiltrates Neo-Nazis...
8594 -
 15:04
15:04
MetatronGaming
1 day agoOriginal Commodore 64 VS C64 Maxi - Review and Comparison
37 -
 9:46
9:46
MattMorseTV
10 hours ago $7.75 earnedTrump just SHUT DOWN a $287,000,000 FRAUD RING.
6.59K52 -
 15:48
15:48
GritsGG
12 hours agoWinning a Rare Solos Prison End Game on Warzone!
59 -
 11:37
11:37
The Pascal Show
12 hours agoTHEY WANT TO END HER?! Candace Owens Claims French President & First Lady Put A H*t Out On Her?!
791 -
 LIVE
LIVE
Lofi Girl
2 years agoSynthwave Radio 🌌 - beats to chill/game to
253 watching -
 24:30
24:30
DeVory Darkins
13 hours agoMarjorie Taylor Greene RESIGNS as Minnesota dealt MAJOR BLOW after fraud scheme exposed
43.2K111 -
 2:19:48
Badlands Media
1 day agoDevolution Power Hour Ep. 409: Panic in the Narrative — Epstein, Israel, and the Manufactured Meltdowns
152K40 -
 1:52:38
Man in America
10 hours agoCommunists VS Zionists & the Collapse of the American Empire w/ Michael Yon
59K25