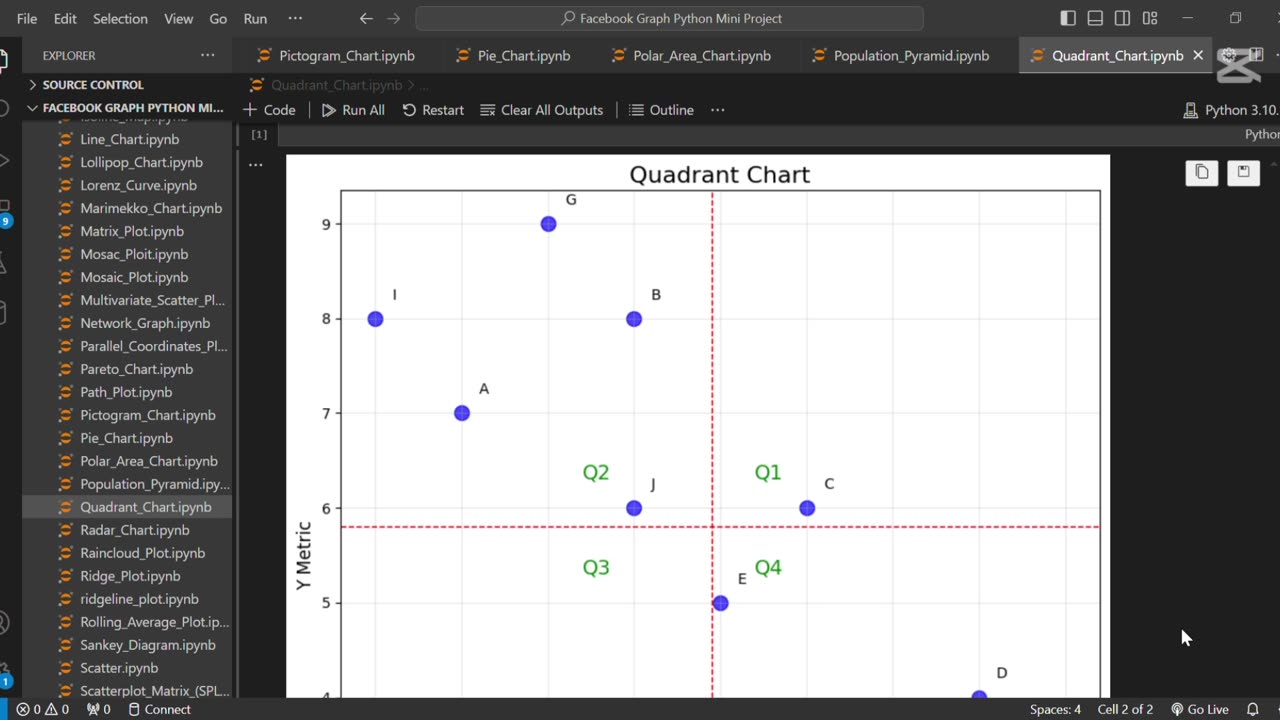
📍 Create Quadrant Chart Using Python
4 months ago
2
The line **"📍 Create Quadrant Chart Using Python"** refers to building a chart that divides data into four quadrants based on two variables, helping to categorize and compare items visually. Python libraries like Matplotlib or Plotly are commonly used to create such charts for decision-making and performance analysis.
Loading comments...
-
 0:16
0:16
AI Evolutionary Technology
8 days agoCreate Email Check Account Services Using Python
2 -
 1:59:01
The Charlie Kirk Show
2 hours agoCancel Netflix? + The Secret Service Disaster + Turning Point Everywhere | Tatum, Cocca, Gaffrey
50.4K30 -
 LIVE
LIVE
ahdedazs
1 hour agoBlack Ops 7 EARLY ACCESS BETA! First Stream on RUMBLE!
83 watching -
 LIVE
LIVE
ZENNY
1 hour agoBO7 IS HERE BOT POV MF HAHAHAHA 6v6 PG18+ | UNFILTERED CHAT | CURSES AND BAD
101 watching -
 LIVE
LIVE
qixso
2 hours ago $0.26 earnedBO7 IS HERE TAP IN !! | @qixso
113 watching -
 1:37:49
Tucker Carlson
15 hours agoBlackmail, Bribes, and Fear: Netanyahu Claims He Controls Donald Trump and America. Tucker Responds.
58.3K236 -
 1:37:29
The Mel K Show
3 hours agoMORNINGS WITH MEL K - Information Warfare & Common Sense 10-2-25
8.16K5 -
 1:26:12
Steven Crowder
5 hours agoThe Left is Violent (Part 2) | Change My Mind
273K424 -
 40:54
40:54
The Rubin Report
3 hours ago‘The View’ Hosts Aghast When Mamdani Accidentally Repeats Hamas Talking Points
44.1K65 -
 1:50:50
Benny Johnson
4 hours agoElon Declares WAR on Netflix, Stock COLLAPSES as Millions CANCEL | Dems HUMILIATED in Trump Meme War
92.1K151