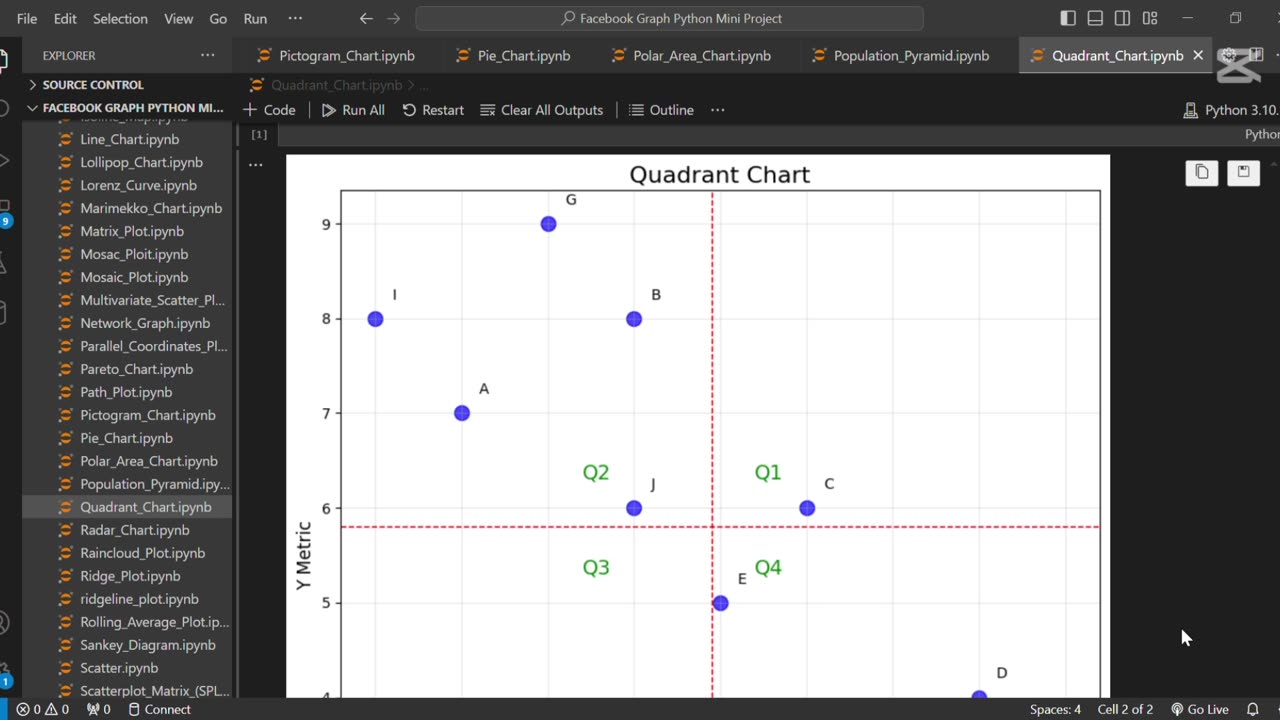
📍 Create Quadrant Chart Using Python
5 months ago
6
The line **"📍 Create Quadrant Chart Using Python"** refers to building a chart that divides data into four quadrants based on two variables, helping to categorize and compare items visually. Python libraries like Matplotlib or Plotly are commonly used to create such charts for decision-making and performance analysis.
Loading comments...
-
 0:18
0:18
AI Evolutionary Technology
1 month ago💰 Simple Currency Converter App in Python
32 -
 LIVE
LIVE
Camhigby
3 hours agoLIVE - Riot Watch Portland, DC, NC
217 watching -
 2:54:58
CAMELOT331
5 hours agoYouTube Just Told Me I OWE THOUSANDS $ TO THEM... update
20.2K2 -
 2:00:53
Tundra Tactical
12 hours ago $0.89 earned🛑LIVE AT 9PM CST!! Your Government Hates Your Guns : DOJ Holds Firm On National FIREARMS ACT
13.3K -
 LIVE
LIVE
DLDAfterDark
3 hours ago $1.16 earnedAre YOU The Guy That Ruins Thanksgiving?? - God Guns & Gear
309 watching -
 2:58:31
NewsTreason
4 hours agoDECLAS w/ Rambo & Dave: Nuremberg 2.0 | MTG Exits Stage Left | Mamdani Psyop Confirmed, 8pm EST
61.8K59 -
 LIVE
LIVE
meleegames
4 hours agoSONG REQUESTS CLOSED - Melee Music - Beat Hazard 3 - Devil Inside
234 watching -
 2:13:31
The Connect: With Johnny Mitchell
11 hours ago $1.62 earnedIs Garth Brooks A Serial Killer? Exposing The Dark Secrets Of Country Music's Biggest Star
10.8K2 -
 1:00:49
MattMorseTV
5 hours ago $79.23 earned🔴Massive VICTORY in the SUPREME COURT.🔴
100K126 -
 LIVE
LIVE
GritsGG
4 hours ago#1 Most Warzone Wins 4015+!
78 watching