📍 Create Quadrant Chart Using Python
5 months ago
4
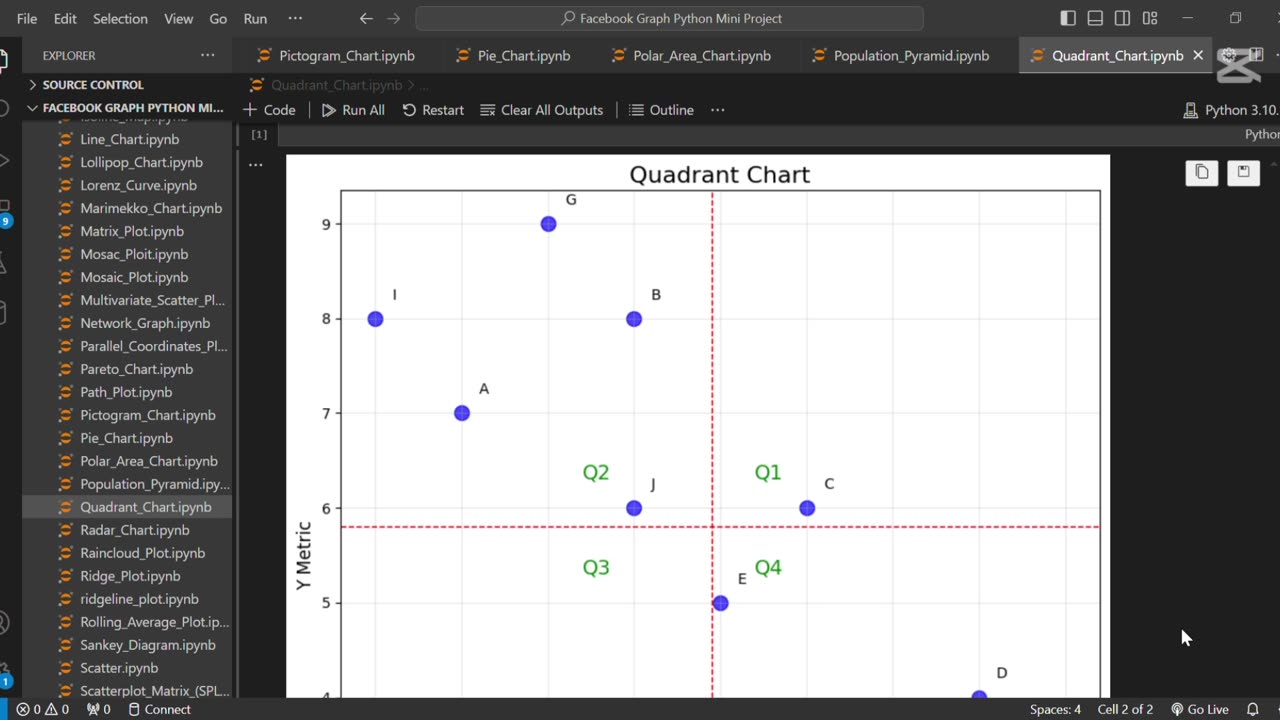
The line **"📍 Create Quadrant Chart Using Python"** refers to building a chart that divides data into four quadrants based on two variables, helping to categorize and compare items visually. Python libraries like Matplotlib or Plotly are commonly used to create such charts for decision-making and performance analysis.
Loading comments...
-
 1:02
1:02
AI Evolutionary Technology
1 month agoLive Weather App in Python | BeautifulSoup & Web Scraping Tutorial
81 -
 21:38
21:38
Professor Nez
20 hours agoTrump JUST BROKE the INTERNET with SAVAGE Line on Ilhan Omar!
42.3K58 -
 1:17:52
Dialogue works
3 days ago $10.17 earnedMartin Armstrong: This Is How World War III Starts… And It Already Has
36.4K18 -
 38:16
38:16
daniellesmithab
3 days agoAlberta Update: Getting Kids Back to the Classroom
28.4K11 -
 20:48
20:48
BlaireWhite
5 days agoTrans TikTokers Are Crashing Out (Over Nothing)
32.6K11 -
 2:07:06
Side Scrollers Podcast
22 hours agoHasan Piker CAUGHT LYING AGAIN + Twitch URGES LEFTIST IDEOLOGY + More | Side Scrollers
74.8K11 -
 8:40
8:40
MattMorseTV
17 hours ago $14.34 earnedSchumer just KICKED OFF the Left-Wing CIVIL WAR.
35.8K33 -
 21:39
21:39
Nikko Ortiz
2 days agoI Take A North Korean Shooting
33.5K6 -
 1:46:26
The Michelle Moore Show
21 hours ago'The Religion Invasion In the U.S. and the Deep State Agenda' Guest, Mark Taylor: The Michelle Moore Show (Nov 3, 2025)
41.9K41 -
 LIVE
LIVE
TruthStream with Joe and Scott
5 days agoSovereign Codes & Cosmic Infrastructure,Ufo's, UAP's, Monads, Matrix Satellites, Interstellar Visitors, SYRONA #505
314 watching