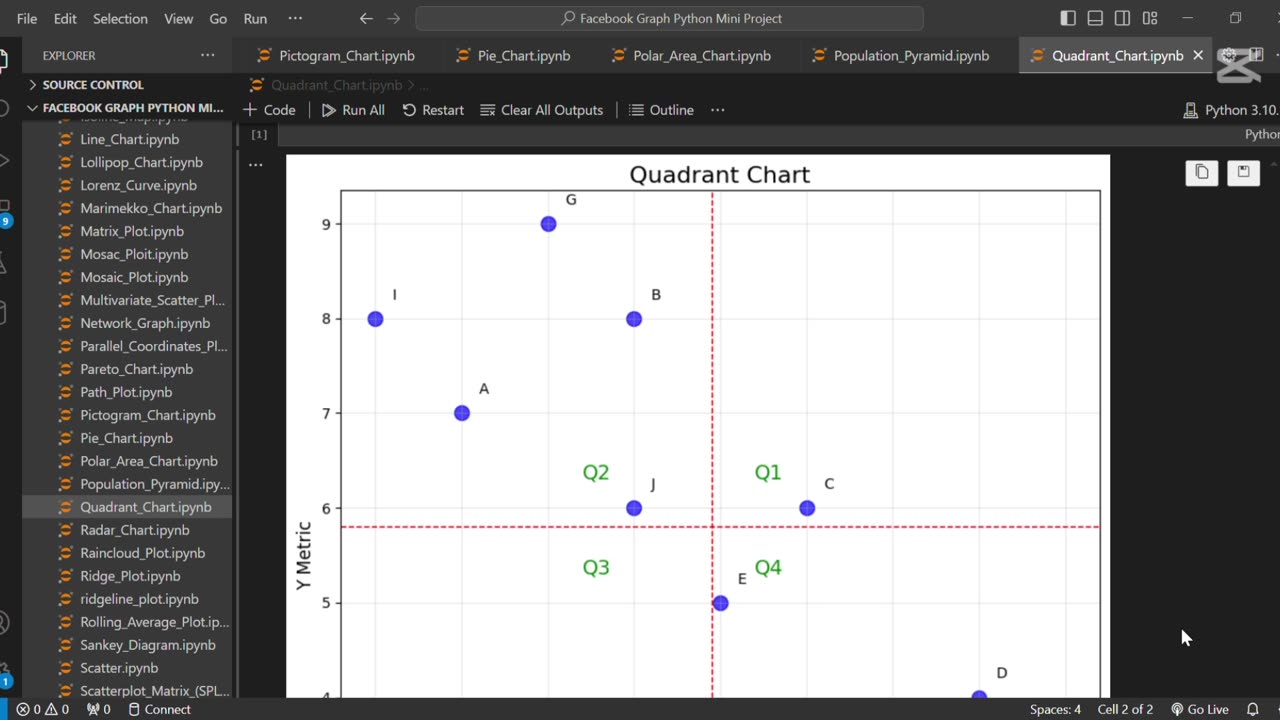
📍 Create Quadrant Chart Using Python
5 months ago
6
The line **"📍 Create Quadrant Chart Using Python"** refers to building a chart that divides data into four quadrants based on two variables, helping to categorize and compare items visually. Python libraries like Matplotlib or Plotly are commonly used to create such charts for decision-making and performance analysis.
Loading comments...
-
 0:20
0:20
AI Evolutionary Technology
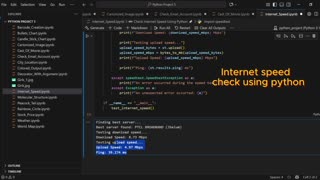
1 month agoUsing Python to Analyze Your Internet Connection
171 -
 11:37
11:37
The Pascal Show
12 hours agoTHEY WANT TO END HER?! Candace Owens Claims French President & First Lady Put A H*t Out On Her?!
791 -
 LIVE
LIVE
Lofi Girl
2 years agoSynthwave Radio 🌌 - beats to chill/game to
253 watching -
 24:30
24:30
DeVory Darkins
13 hours agoMarjorie Taylor Greene RESIGNS as Minnesota dealt MAJOR BLOW after fraud scheme exposed
43.2K111 -
 2:19:48
Badlands Media
1 day agoDevolution Power Hour Ep. 409: Panic in the Narrative — Epstein, Israel, and the Manufactured Meltdowns
152K40 -
 1:52:38
Man in America
10 hours agoCommunists VS Zionists & the Collapse of the American Empire w/ Michael Yon
59K25 -
 4:09:34
Akademiks
5 hours agoSheck Wes exposes Fake Industry. Future Not supportin his mans? D4VD had help w disposing his ex?
35.9K3 -
 6:43:43
SpartakusLIVE
9 hours agoTeam BUNGULATORS || From HUGE WZ DUBS to TOXIC ARC BETRAYALS
108K3 -
 2:44:56
BlackDiamondGunsandGear
5 hours agoAre You that guy? / Carrying a Pocket Pistol /After Hours Armory
22.3K -
 DVR
DVR
Camhigby
5 hours agoLIVE - Riot Watch Portland, DC, NC
23.7K20