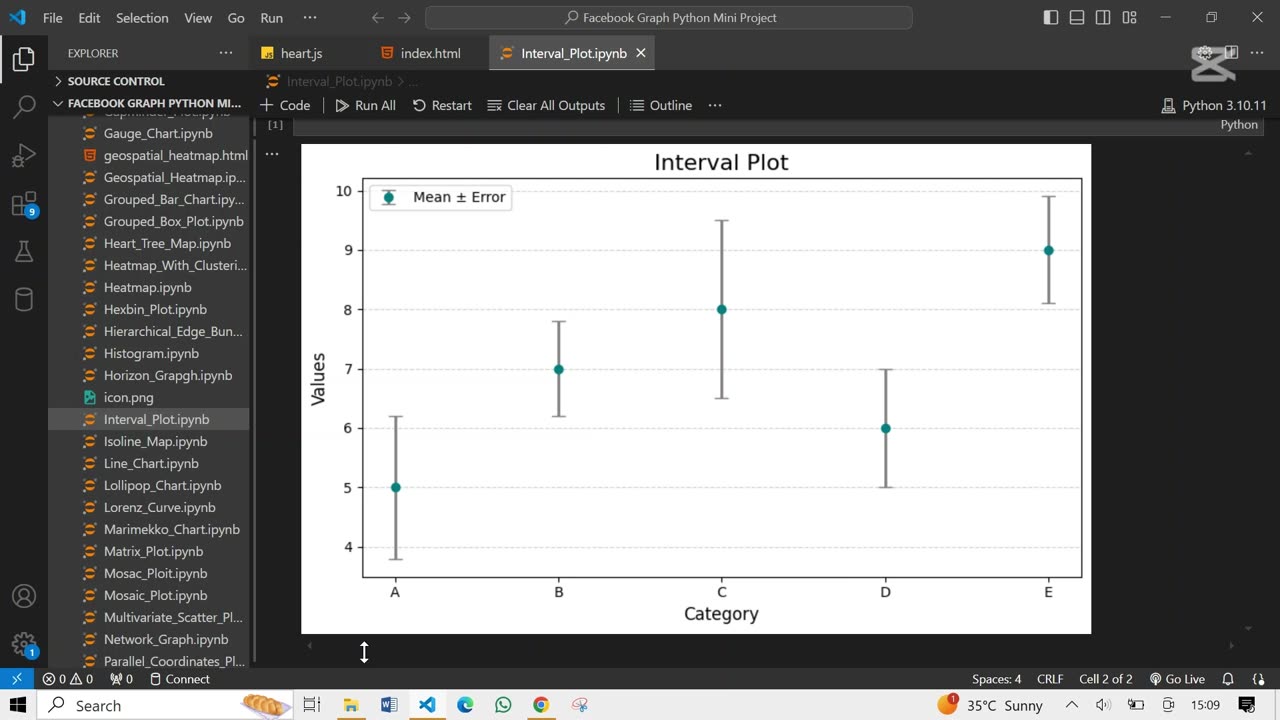
⏳ Create The Interval Plot Using Python
Loading comments...
-
 0:18
0:18
AI Evolutionary Technology
1 month ago💰 Simple Currency Converter App in Python
20 -
 1:30:53
Kim Iversen
2 hours agoAmerica Under INVASION - Sharia Law Wins In New York City?
76.3K176 -
 50:45
50:45
Redacted News
2 hours agoNick Fuentes & Tucker Carlson DESTROY Ben Shapiro, Cuomo collapses to a socialist | Redacted
27.6K62 -

Dr Disrespect
8 hours ago🔴LIVE - DR DISRESPECT - BATTLEFIELD 6 - REDSEC - 10 WINS CHALLENGE
164K10 -
 LIVE
LIVE
Akademiks
3 hours agoAdin Ross x 6ix9ine x Akademiks stream
642 watching -
 LIVE
LIVE
StoneMountain64
5 hours agoBattlefield REDSEC HARDCORE, Ultra Movement, and CRAZY Portal Games
122 watching -
 1:09:44
Russell Brand
7 hours agoFrom Curb Your Enthusiasm to Courage — Cheryl Hines on Hollywood, RFK Jr. & Speaking Out - SF646
139K35 -
 1:30:26
The Quartering
6 hours agoWoke Is Back!
133K63 -
 1:18:21
DeVory Darkins
7 hours agoTrump issues CHILLING WARNING to GOP as SCOTUS hears arguments regarding Tariffs
119K108 -
 3:35:48
Barry Cunningham
7 hours agoBREAKING NEWS: PRESIDENT TRUMP SPEECH AT THE MIAMI BUSINESS FORUM! (MIKE JOHNSON PRESSER)
112K31