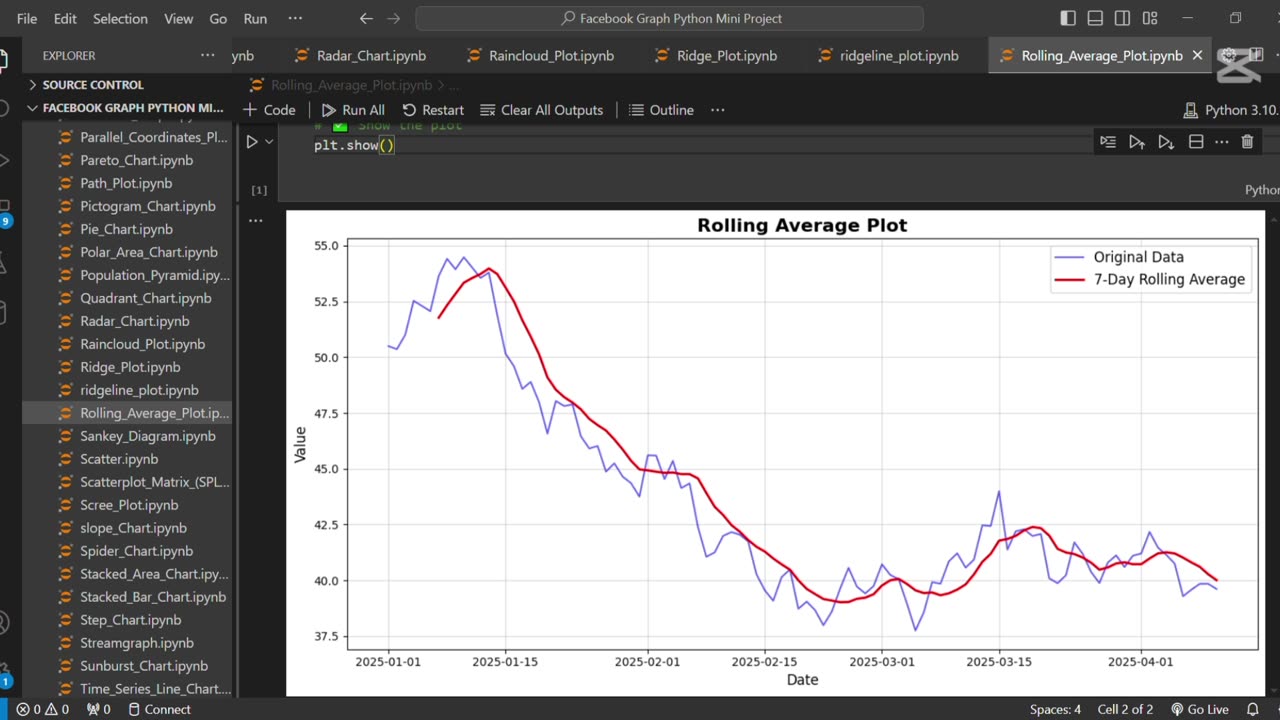
Create a rolling average plot using Python 📈
Loading comments...
-
 1:05
1:05
AI Evolutionary Technology
6 days agoCreate Your Own Python Decorator | Repeat Functions Like a Pro
7 -
 LIVE
LIVE
The Charlie Kirk Show
58 minutes agoMichael Knowles, Matt Walsh, and Ben Shapiro Remember Charlie Kirk | 9.16.2025
45,766 watching -
 LIVE
LIVE
Steven Crowder
3 hours ago🔴 The Lies are Sick: Charlie Kirk's Legacy Separating Fact from Fiction
33,312 watching -
 1:07:59
NotTheBee
1 day agoOur Memories Of Charlie Kirk And What This Means For The Country
34.8K21 -

The Rubin Report
2 hours agoListen to the Fear in Whoopi Goldberg’s Voice on 'The View' as She Gives a Chilling Warning
39.5K27 -
 LIVE
LIVE
The Mel K Show
1 hour agoMORNINGS WITH MEL K - Constitution Incompatible with Globalist Goals 9-16-25
585 watching -
 LIVE
LIVE
Grant Stinchfield
1 hour agoRFK Jr. Speaks Out: The Pain of Assassination & the Loss of Charlie Kirk
79 watching -
 1:59:33
Benny Johnson
2 hours agoKash Patel Testifying LIVE Now on Charlie Kirk Assassination, Trump to Declare Antifa TERRORISTS?!
72.5K48 -
 2:07:38
Timcast
3 hours ago🚨LIVE: Kash Patel Testifies Over Charlie Kirk Assassination In Senate | Tim Pool
82.9K55 -
 LIVE
LIVE
Trumpet Daily
57 minutes agoTrumpet Daily LIVE | Sept. 16, 2025
509 watching