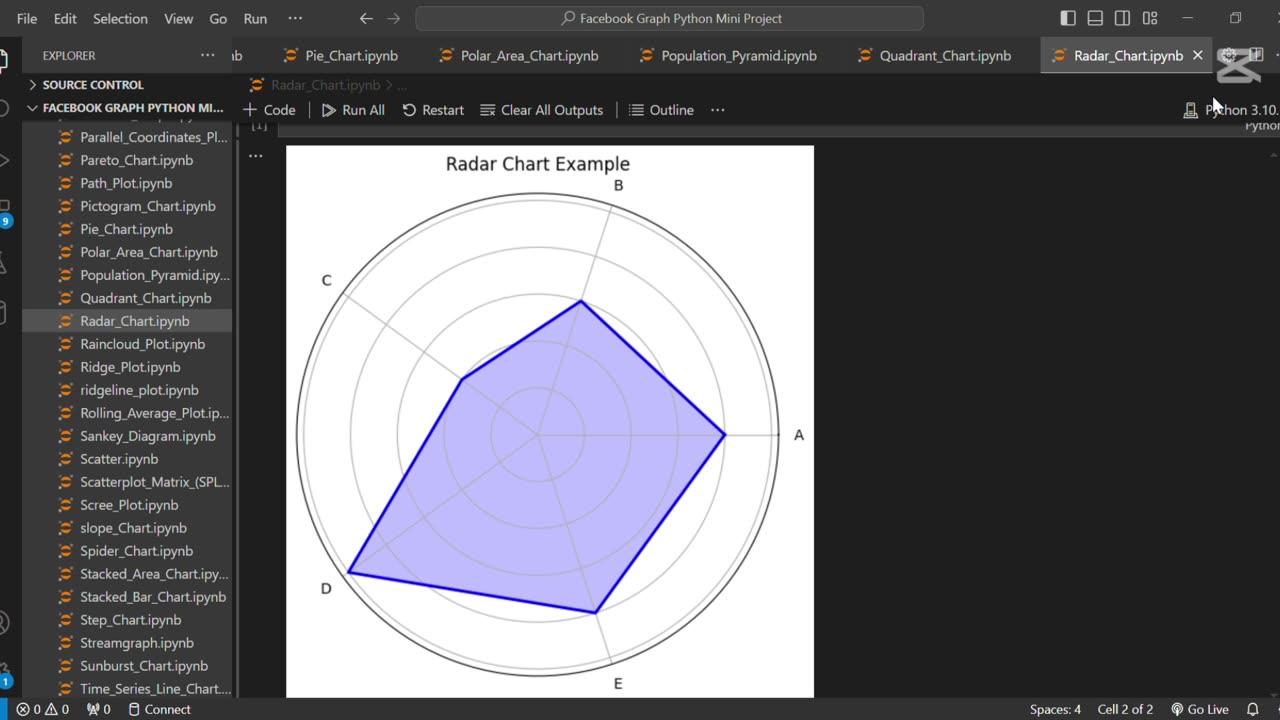
Create a Radar Chart using Python 🐍
Loading comments...
-
 0:17
0:17
AI Evolutionary Technology
1 day agoVisualizing Molecular Structure From SMILES Using RDKit 🧪
1 -
 2:01:45
MattMorseTV
2 hours ago $2.50 earned🔴Reacting to SAM HYDE.🔴
19.2K6 -
 1:17:36
Russell Brand
3 hours agoTommy Robinson UK rally “draws 3 MILLION”, Trump Launches Investigation of Left - SF633
58.9K14 -
 LIVE
LIVE
The HotSeat
1 hour agoThe Truth About Tyler Robinson & Church Leaders: Exposing Weekend Lies — You’re On My List
982 watching -
 LIVE
LIVE
Film Threat
18 hours agoVERSUS: SPINAL TAP II + FALL PREVIEW | Film Threat Versus
87 watching -
![[Ep 748] Revival - The God Effect Through Charlie | You’re Fired! | Iryna Zarutska Update](https://1a-1791.com/video/fww1/28/s8/1/K/o/l/i/Koliz.0kob-small-Ep-748-Revival-The-God-Effe.jpg) LIVE
LIVE
The Nunn Report - w/ Dan Nunn
1 hour ago[Ep 748] Revival - The God Effect Through Charlie | You’re Fired! | Iryna Zarutska Update
190 watching -
 LIVE
LIVE
Right Side Broadcasting Network
7 hours agoLIVE: President Trump Signs a Presidential Memorandum - 9/15/25
4,660 watching -
 1:29:01
Sean Unpaved
4 hours agoTurf Tumbles & Triumphs: Burrow's Setback, Chiefs' Crumble, Irish Iced, & Kelly's 3-0
34.2K -
 34:27
34:27
The Quiet Part
6 hours ago $0.21 earnedCanada DIDN'T EVEN TRY!
4.95K4 -
 LIVE
LIVE
SportsPicks
5 hours agoCrick's Corner: Episode 80
49 watching