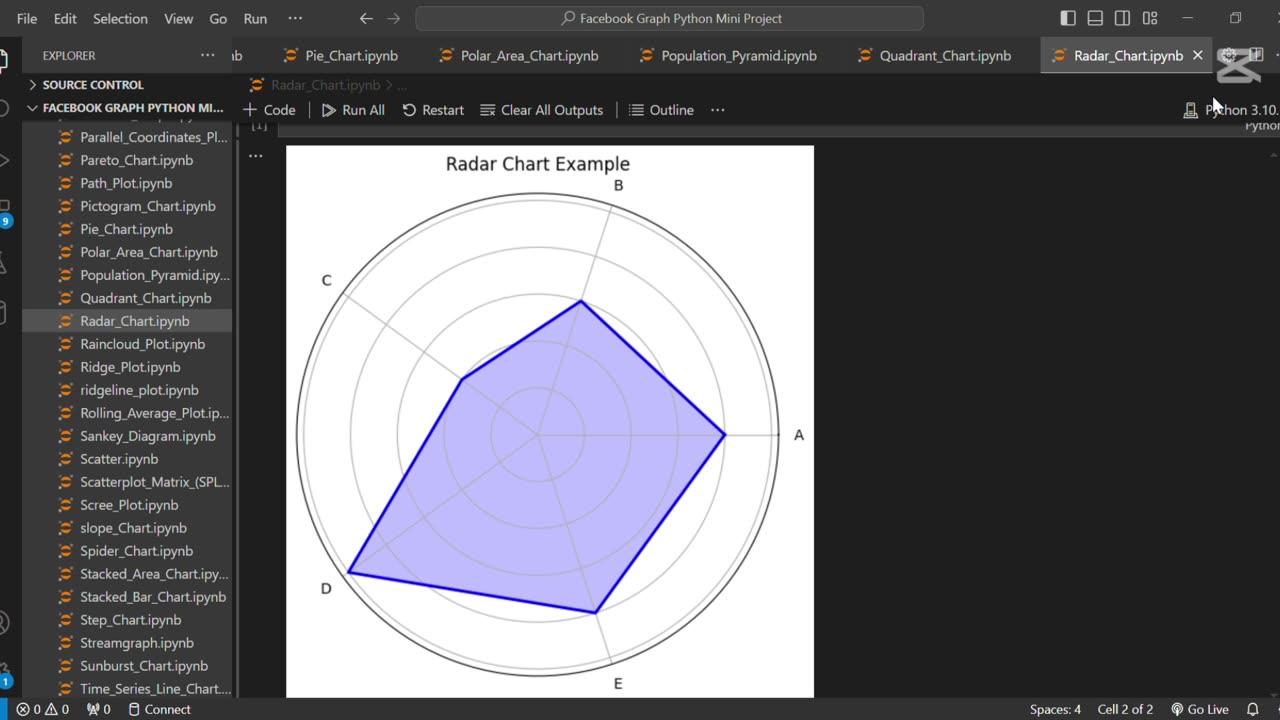
Create a Radar Chart using Python 🐍
Loading comments...
-
 1:02
1:02
AI Evolutionary Technology
2 months agoLive Weather App in Python | BeautifulSoup & Web Scraping Tutorial
101 -
 23:40
23:40
MYLUNCHBREAK CHANNEL PAGE
1 day agoWe Want the Blueprints
45.5K13 -
 LIVE
LIVE
PenguinSteve
3 hours agoLIVE! Penguin to the Battlefield (6)
70 watching -
 1:08:20
The Quartering
4 hours agoMTG Quits, Indian X Meltdown & FBI Caught Lying Again About Trump Assassin
123K70 -
 1:01:33
Jeff Ahern
4 hours ago $9.14 earnedThe Saturday Show with Jeff Ahern
37.6K22 -
 18:08
18:08
Professor Nez
5 hours ago🚨HOLY CRAP: Members of Congress Call for Military INSURRECTION!
102K90 -
 4:14:26
Grant Cardone
8 hours agoHow to Buy Real Estate With NO Money Down (LIVE Training With Grant Cardone)
102K7 -
 1:56:11
AlaskanBallistics
15 hours ago $4.88 earnedShooting the WhisperStrike WT30 Live!
19.5K5 -
 19:53
19:53
MetatronHistory
21 hours agoRome VS Greece - Ultimate Clash of Civilizations Explained
58K16 -
 LIVE
LIVE
The Big Mig™
8 hours agoThe Big Mig Show's Greatest Hits w/ Americas Future, Karmageddon, Operation Gideon,..
131 watching