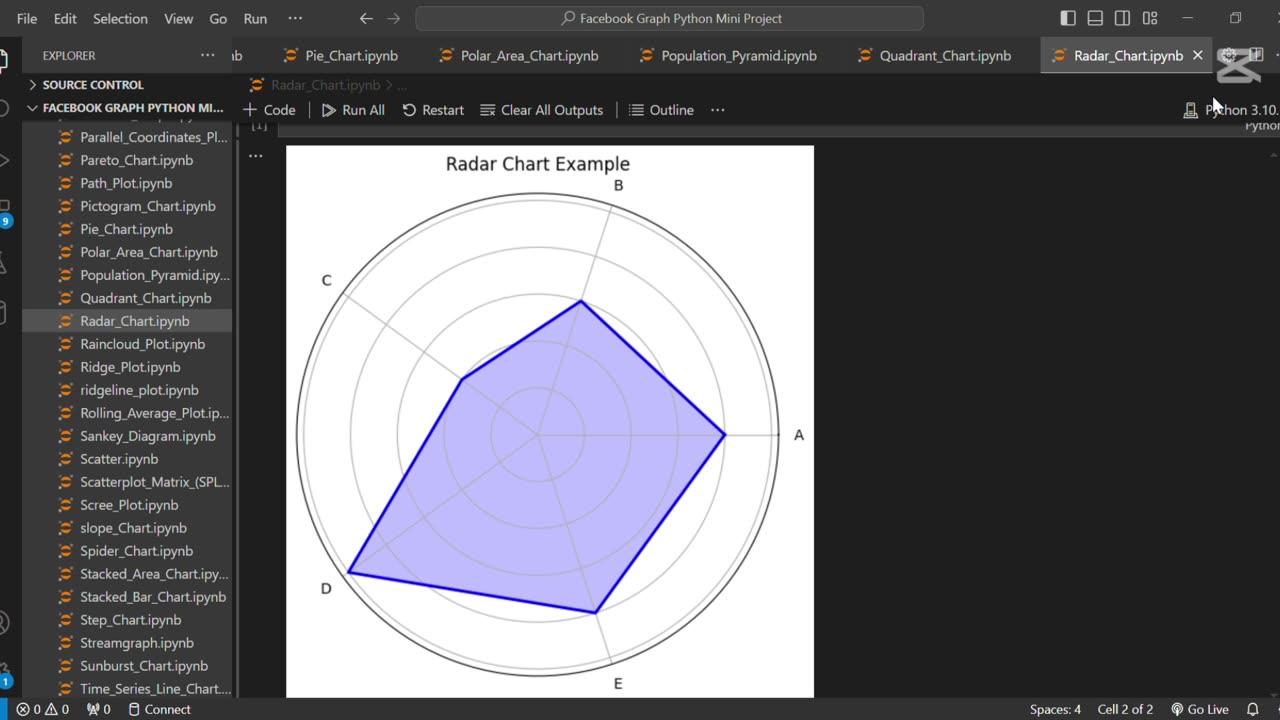
Create a Radar Chart using Python 🐍
Loading comments...
-
 1:02
1:02
AI Evolutionary Technology
2 months agoLive Weather App in Python | BeautifulSoup & Web Scraping Tutorial
101 -
 LIVE
LIVE
meleegames
1 hour agoSONG REQUESTS CLOSED - Melee Music - Beat Hazard 3 - Devil Inside
94 watching -
 LIVE
LIVE
The Connect: With Johnny Mitchell
9 hours agoIs Garth Brooks A Serial Killer? Exposing The Dark Secrets Of Country Music's Biggest Star
126 watching -
 1:00:49
MattMorseTV
2 hours ago $53.63 earned🔴Massive VICTORY in the SUPREME COURT.🔴
71.9K52 -
 LIVE
LIVE
GritsGG
1 hour ago#1 Most Warzone Wins 4015+!
89 watching -
 4:20:08
Biscotti-B23
4 hours ago🔴 LIVE STREAM ENDS WHEN I GET 100 WINS 🥵 INVINCIBLE VS CLOSED ALPHA
2.66K1 -
 12:38
12:38
Timcast
1 day agoJasmine Crocket HUMILIATED By CNN To HER FACE Over Epstein LIE | Tim Pool
102K72 -
 19:32
19:32
MetatronHistory
22 hours agoWas Nazism Left Wing or Right Wing? An Answer From History
23.4K47 -
 1:54:20
Mally_Mouse
22 hours ago🌶️ 🥵Spicy BITE Saturday!! 🥵🌶️- Let's Play: Human Fall Flat
62K3 -
 4:36
4:36
GreenMan Studio
4 hours agoTHE RUMBLE COLLAB SHOW EP. 5 W/Greenman Reports
1.35K3