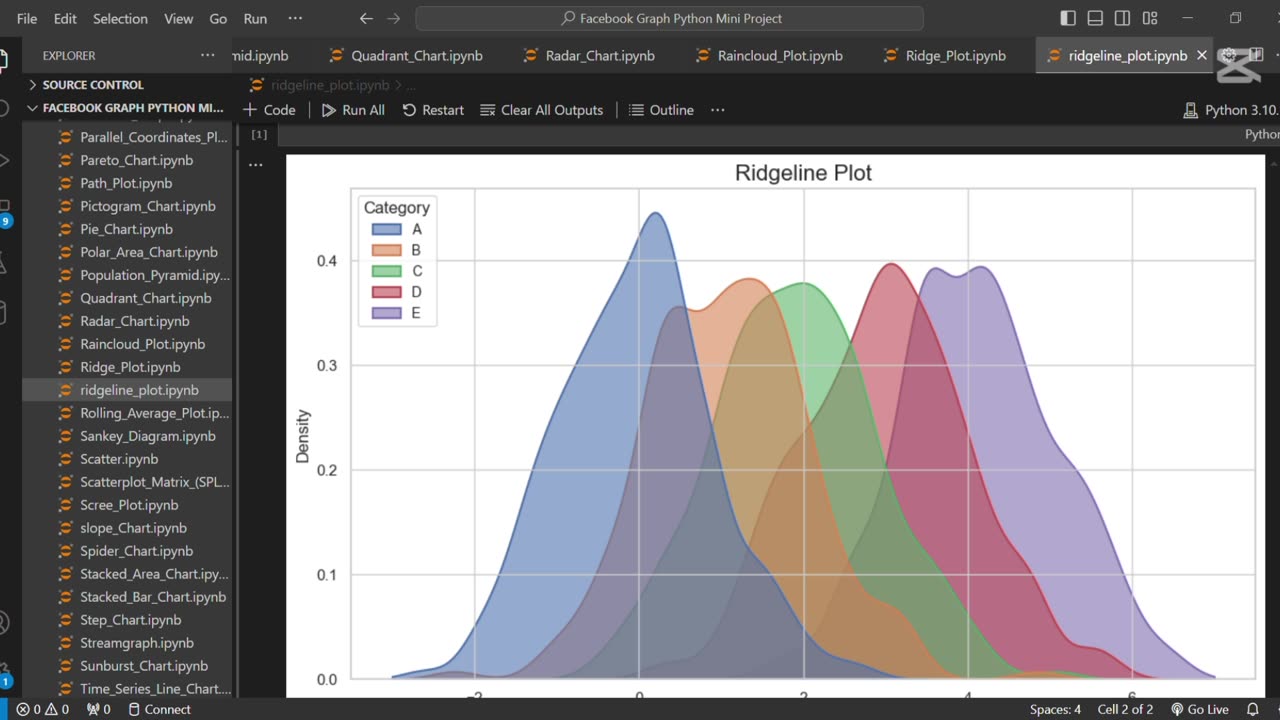
Create Beautiful Ridgeline Plots in Python using Seaborn 🌄
3 months ago
8
Unlock the power of ridgeline plots to visualize distributions across multiple categories with elegance.
Using Seaborn and a few handy tweaks, you can create smooth, layered plots that are both insightful and beautiful.
Perfect for comparing trends in data over time or across groups with a stunning visual appeal. 🌈
Loading 1 comment...
-
 0:52
0:52
AI Evolutionary Technology
7 days ago📦 Ignoring Built-In Functions and Libraries Using Python 🐍
3 -
 2:04:21
Badlands Media
14 hours agoDevolution Power Hour Ep. 388: Assassination, Inflection Points, and the Battle Ahead
324K95 -
 2:08:03
Inverted World Live
7 hours agoCharlie Kirk Assassinated | Ep. 106
94.5K44 -
 3:01:07
TimcastIRL
9 hours agoCharlie Kirk Assassinated, Suspect In Custody | Timcast IRL
625K937 -
 5:44:49
Redacted News
11 hours agoTurning the Tide: 9/11 Justice in 2025 — Day 1 with Sen. Ron Johnson, Richard Gage and More
175K78 -
 2:48:00
TheSaltyCracker
9 hours agoYou're Being Hunted ReeEEStream 9-10-25
294K590 -
 13:09:56
LFA TV
22 hours agoBREAKING: CHARLIE KIRK ASSASSINATED - WEDNESDAY 9/10/25
378K127 -
 1:31:08
I_Came_With_Fire_Podcast
9 hours agoCheck Fire: God Bless Charlie Kirk
93.9K24 -
 1:13:35
Glenn Greenwald
11 hours agoCharlie Kirk Assassinated; NATO Alleges Russian Drones Flew Over Poland, and More | SYSTEM UPDATE #512
291K299 -
 1:46:28
Badlands Media
1 day agoAltered State S3 Ep. 45: The Assassination of Charlie Kirk
167K29