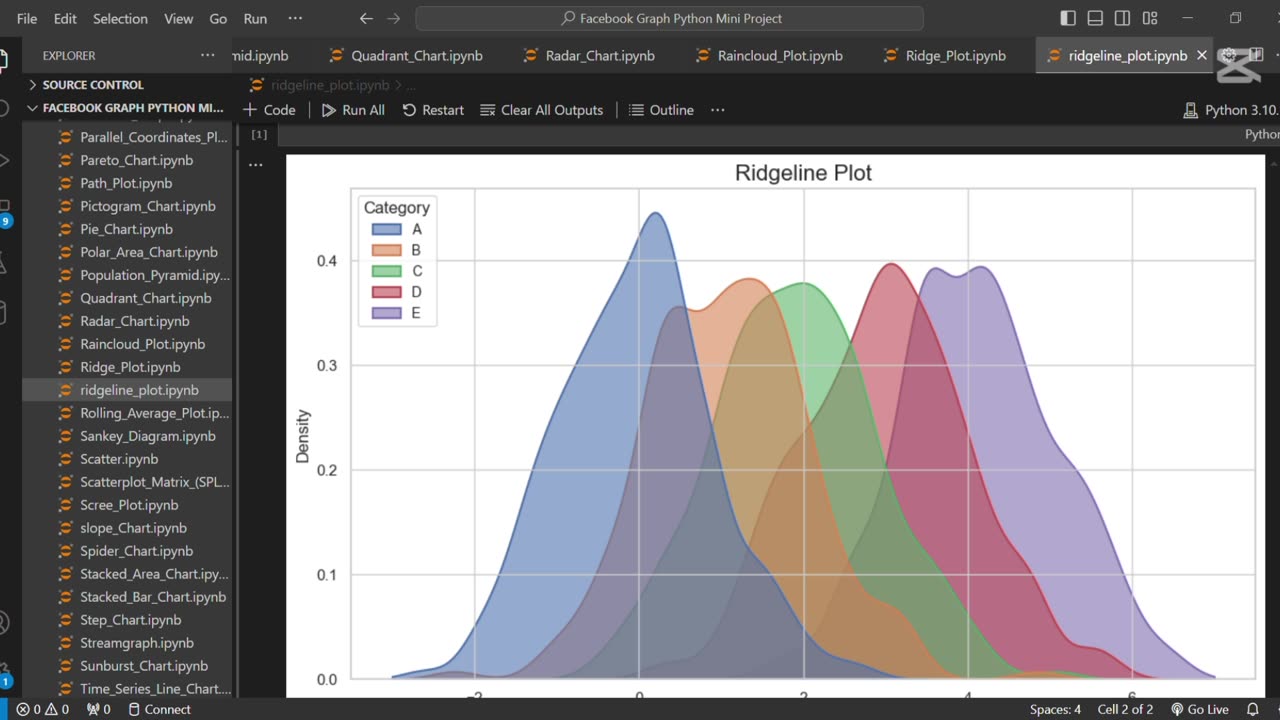
Create Beautiful Ridgeline Plots in Python using Seaborn 🌄
4 months ago
8
Unlock the power of ridgeline plots to visualize distributions across multiple categories with elegance.
Using Seaborn and a few handy tweaks, you can create smooth, layered plots that are both insightful and beautiful.
Perfect for comparing trends in data over time or across groups with a stunning visual appeal. 🌈
Loading 1 comment...
-
 0:17
0:17
AI Evolutionary Technology
17 days agoVisualizing Molecular Structure From SMILES Using RDKit 🧪
1 -
 LIVE
LIVE
Russell Brand
1 hour agoPfizer Agrees $70 Million Deal With Trump As Study Links Covid Vax to CANCER!! - SF644
2,551 watching -
 LIVE
LIVE
Sean Unpaved
2 hours agoOctober Blitz: Wild Card Game 3s, CFB Coaching Chaos, & TNF Fireworks
299 watching -
 LIVE
LIVE
Dr Disrespect
3 hours ago🔴LIVE - DR DISRESPECT - BLACK OPS 7 MULTIPLAYER GAMEPLAY - NEW!
1,701 watching -
 1:01:36
Dear America
1 hour agoEpisode 2 Graham Allen Show
6.93K20 -
 1:59:01
The Charlie Kirk Show
2 hours agoCancel Netflix? + The Secret Service Disaster + Turning Point Everywhere | Tatum, Cocca, Gaffrey
50.4K30 -
 LIVE
LIVE
ahdedazs
1 hour agoBlack Ops 7 EARLY ACCESS BETA! First Stream on RUMBLE!
82 watching -
 LIVE
LIVE
ZENNY
1 hour agoBO7 IS HERE BOT POV MF HAHAHAHA 6v6 PG18+ | UNFILTERED CHAT | CURSES AND BAD
99 watching -
 LIVE
LIVE
qixso
2 hours ago $0.26 earnedBO7 IS HERE TAP IN !! | @qixso
110 watching -
 1:37:49
Tucker Carlson
15 hours agoBlackmail, Bribes, and Fear: Netanyahu Claims He Controls Donald Trump and America. Tucker Responds.
58.3K236