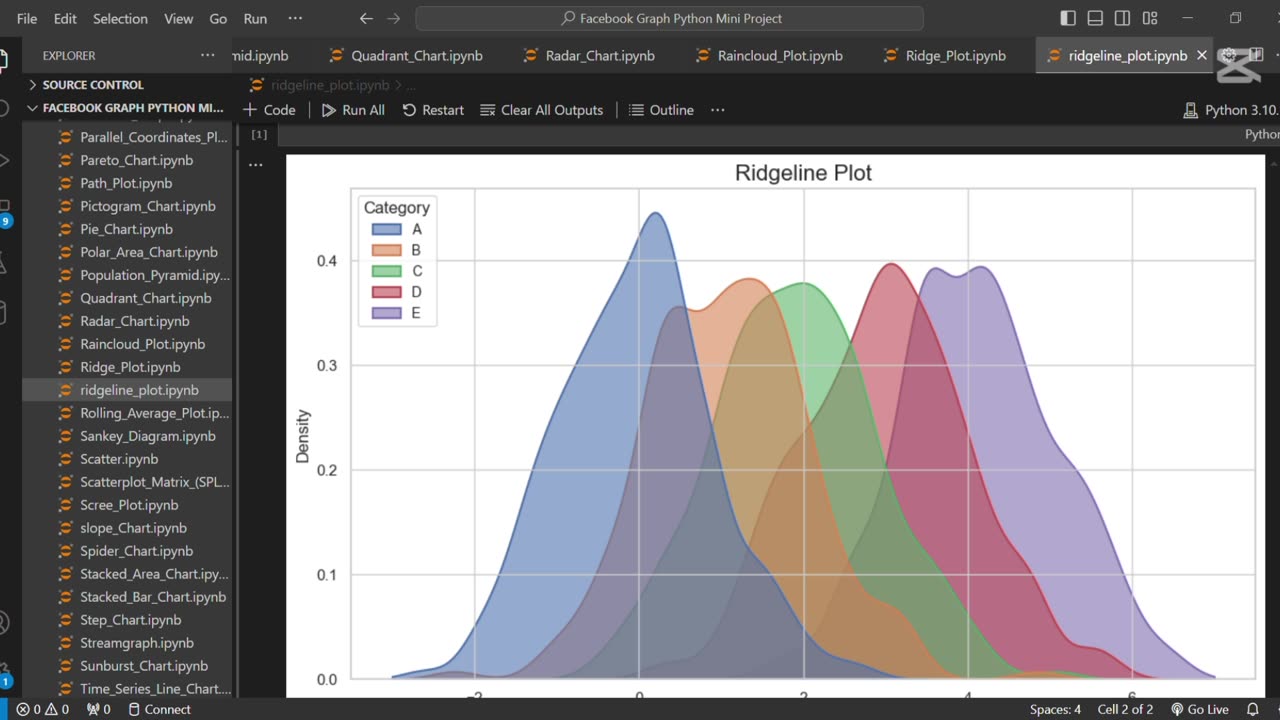
Create Beautiful Ridgeline Plots in Python using Seaborn 🌄
6 months ago
8
Unlock the power of ridgeline plots to visualize distributions across multiple categories with elegance.
Using Seaborn and a few handy tweaks, you can create smooth, layered plots that are both insightful and beautiful.
Perfect for comparing trends in data over time or across groups with a stunning visual appeal. 🌈
Loading 1 comment...
-
 0:18
0:18
AI Evolutionary Technology
1 month ago💰 Simple Currency Converter App in Python
32 -
 LIVE
LIVE
Akademiks
15 minutes agoSheck Wes exposes Fake Industry. Future Not supportin his mans? D4VD had help w disposing his ex?
581 watching -
 LIVE
LIVE
SpartakusLIVE
4 hours agoTeam BUNGULATORS || From HUGE WZ DUBS to TOXIC ARC BETRAYALS
2,534 watching -
 LIVE
LIVE
Camhigby
30 minutes agoLIVE - Riot Watch Portland, DC, NC
217 watching -
 LIVE
LIVE
CAMELOT331
2 hours agoYouTube Just Told Me I OWE THOUSANDS $ TO THEM... update
183 watching -
 LIVE
LIVE
Tundra Tactical
10 hours ago🛑LIVE AT 9PM CST!! Your Government Hates Your Guns : DOJ Holds Firm On National FIREARMS ACT
51 watching -
 LIVE
LIVE
NewsTreason
2 hours agoDECLAS w/ Rambo & Dave: Nuremberg 2.0 | MTG Exits Stage Left | Mamdani Psyop Confirmed, 8pm EST
7,890 watching -
 LIVE
LIVE
meleegames
1 hour agoSONG REQUESTS CLOSED - Melee Music - Beat Hazard 3 - Devil Inside
94 watching -
 LIVE
LIVE
The Connect: With Johnny Mitchell
9 hours agoIs Garth Brooks A Serial Killer? Exposing The Dark Secrets Of Country Music's Biggest Star
126 watching -
 1:00:49
MattMorseTV
2 hours ago $53.63 earned🔴Massive VICTORY in the SUPREME COURT.🔴
71.9K52