Create Marimekko chart using Python 📊
📊 How to Make Marimekko Charts with Matplotlib | Step-by-Step Guide | Python Tutorial
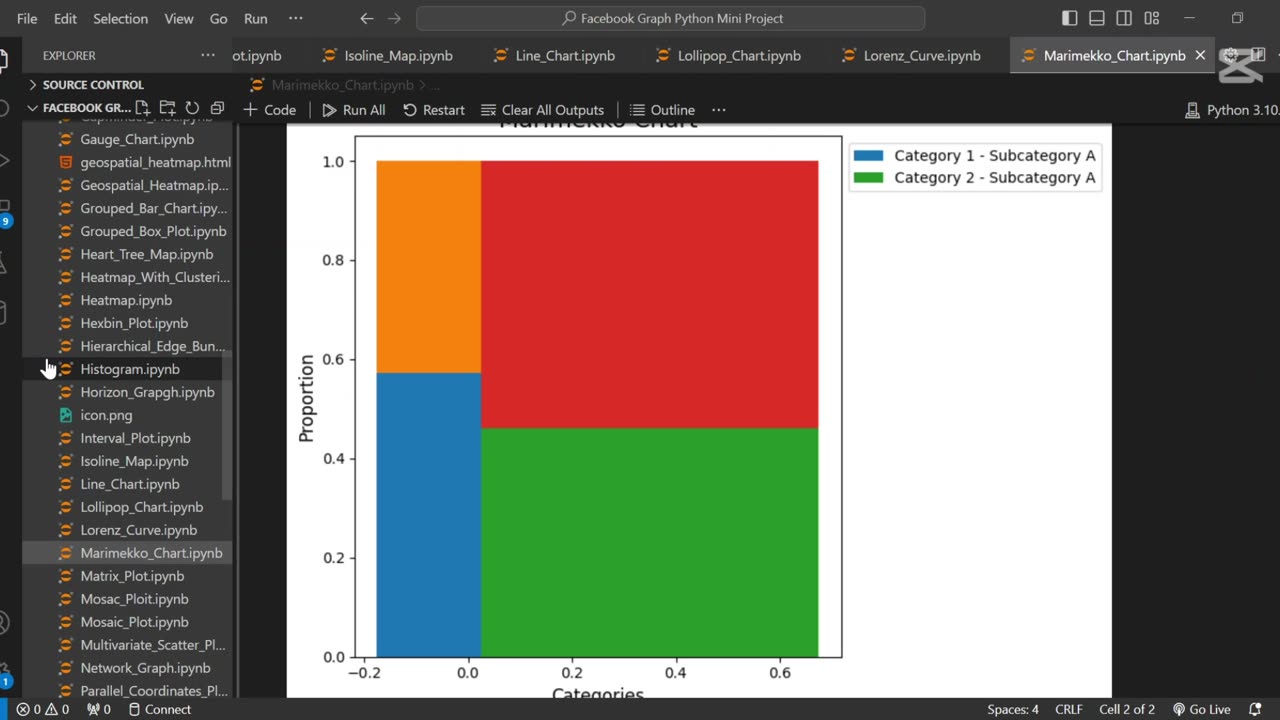
In this Python data visualization tutorial, you’ll learn how to create professional Marimekko Charts (also known as Mosaic Plots) using Matplotlib. Marimekko charts are perfect for visualizing multi-dimensional proportional data, making them essential for business analytics, market research, and data science!
🔹 What You’ll Learn:
✅ How to structure data for Marimekko charts
✅ Step-by-step coding in Python (Matplotlib)
✅ Customizing colors, labels, and legends
✅ Practical use cases for business & data analysis
🚀 Subscribe for More Python & Data Science Tutorials!
🔔 Hit the bell icon to stay updated!
💬 Got questions? Drop them in the comments!
#Python #DataVisualization #MarimekkoChart #Matplotlib #DataScience
#PythonTutorial #Coding #DataAnalysis #Programming #TechTutorial #LearnPython #DataViz #BusinessAnalytics #PythonProgramming #DataVisualizationTutorial
-
 0:20
0:20
AI Evolutionary Technology
1 month agoUsing Python to Analyze Your Internet Connection
171 -
 LIVE
LIVE
a12cat34dog
1 hour agoI'M FINALLY BACK :: Resident Evil 4 (2023) :: FINISHING MAIN GAME & DLC {18+}
265 watching -
 31:23
31:23
Stephen Gardner
1 hour agoFINALLY! Charlie Kirk MISSING DETAILS released!
2.76K26 -
 LIVE
LIVE
cosmicvandenim
6 hours agoCOSMIC VAN DENIM | SEX APPEAL & HORROR
109 watching -
 LIVE
LIVE
DoldrumDan
2 hours agoFINISHING SEKIRO - DEPTH 5 TOP RANKED - DAY 50 NEW LIFE
41 watching -
 23:40
23:40
MYLUNCHBREAK CHANNEL PAGE
1 day agoWe Want the Blueprints
45.5K13 -
 LIVE
LIVE
PenguinSteve
3 hours agoLIVE! Penguin to the Battlefield (6)
70 watching -
 1:08:20
The Quartering
4 hours agoMTG Quits, Indian X Meltdown & FBI Caught Lying Again About Trump Assassin
123K70 -
 1:01:33
Jeff Ahern
4 hours ago $9.14 earnedThe Saturday Show with Jeff Ahern
37.6K22 -
 18:08
18:08
Professor Nez
5 hours ago🚨HOLY CRAP: Members of Congress Call for Military INSURRECTION!
102K90