Create mosaic plot using Python 🧩
5 months ago
7
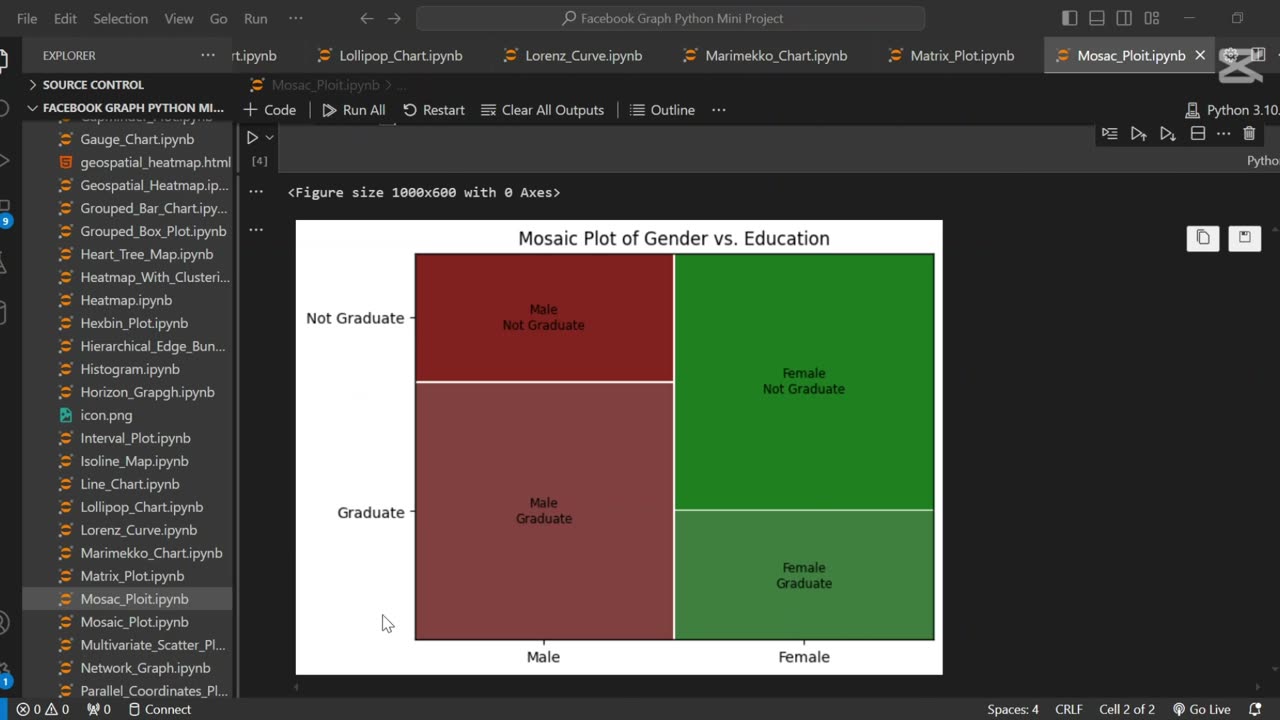
A mosaic plot is a graphical representation of categorical data that visualizes the relationship between two or more variables. 🧩 It displays rectangles whose area is proportional to the frequency of each category combination, making it easy to observe associations and patterns in the data.
In this tutorial, we use Python to generate a mosaic plot using the statsmodels library. We’ll walk through preparing a sample dataset, visualizing categorical relationships (e.g., gender vs. purchase decision), and interpreting the plot. This type of visualization is especially helpful for exploratory data analysis (EDA) and categorical comparison.
Let me know if you’d like a shorter version or a description tailored for a blog, presentation, or report.
Loading comments...
-
 0:17
0:17
AI Evolutionary Technology
1 month agoVisualizing Molecular Structure From SMILES Using RDKit 🧪
4 -
 LIVE
LIVE
Glenn Greenwald
1 hour agoWhy Did Zohran Win & What Does it Mean? Plus: Dick Cheney, "Hero of the Resistance" | SYSTEM UPDATE #543
11,020 watching -
 LIVE
LIVE
vivafrei
43 minutes agoArctic Frost is Bigger Scandal than you Think!! Live with Former Green Beret Ivan Raiklin!
2,131 watching -
 DVR
DVR
BonginoReport
2 hours agoBlue Wave Crashes Over The Nation On Election Night - Nightly Scroll w/ Hayley Caronia (Ep.171)
28.5K39 -
 LIVE
LIVE
The Jimmy Dore Show
1 hour agoMamdani’s BIG WIN for the Powerful! Candace Owens SHOCKER About Kirk Assassination! w/ Russ Dobular
5,784 watching -
 5:49
5:49
Buddy Brown
6 hours agoTake a Look at the Outdoor MOSQUES in TIMES SQUARE after MAMDANI Win | Buddy Brown
4606 -
 18:15
18:15
ArynneWexler
2 hours agoThe Fall of New York - How Zohran Mamdani Won | NN8
1321 -
 1:30:53
Kim Iversen
2 hours agoAmerica Under INVASION - Sharia Law Wins In New York City?
76.3K176 -
 50:45
50:45
Redacted News
2 hours agoNick Fuentes & Tucker Carlson DESTROY Ben Shapiro, Cuomo collapses to a socialist | Redacted
27.6K62 -

Dr Disrespect
8 hours ago🔴LIVE - DR DISRESPECT - BATTLEFIELD 6 - REDSEC - 10 WINS CHALLENGE
164K10