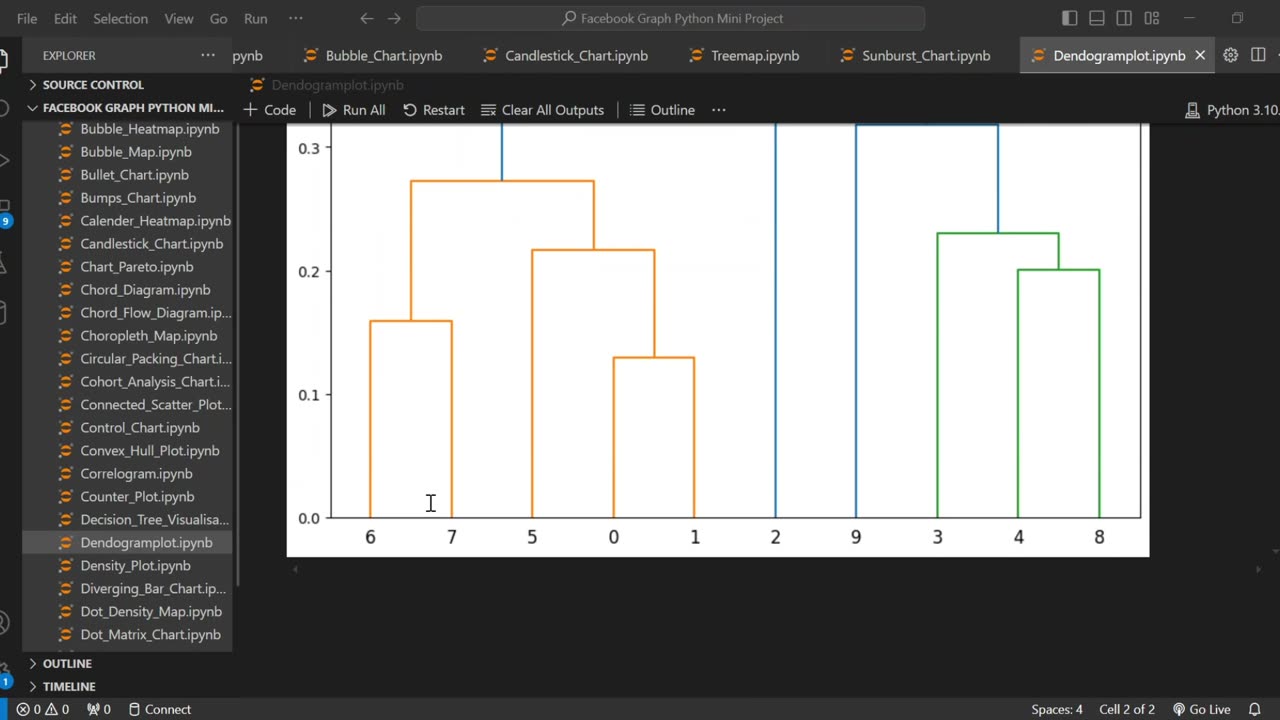
Create a Dendrogram Plot Using Python 🐍🌳
Master Hierarchical Clustering Visualization with Python! In this step-by-step tutorial, you’ll learn how to create and interpret dendrograms using SciPy and Matplotlib – essential skills for data science and machine learning projects.
🔹 What You’ll Learn:
✅ How to generate dendrograms using scipy.cluster.hierarchy
✅ The science behind hierarchical clustering algorithms
✅ How to customize dendrogram plots for better visualization
✅ Real-world applications in bioinformatics, customer segmentation, and NLP
🔔 Subscribe for More Data Science Tutorials! New videos every week on Python, ML, and data visualization.
#Python #DataScience #MachineLearning #AI #ArtificialIntelligence
#DataVisualization #Coding #Programming #Tech #LearnToCode
#Bioinformatics #BigData #DataAnalysis #Algorithms #ML
#SciPy #Matplotlib #DataViz #DeepLearning #NeuralNetworks
-
 0:18
0:18
AI Evolutionary Technology
1 month ago💰 Simple Currency Converter App in Python
20 -
 3:01:00
Wendy Bell Radio
7 hours agoLike Sheep To Slaughter
73.6K100 -
 1:13:30
DML
3 hours agoDML LIVE: NYC Goes Socialist: Mamdani’s Victory
47.1K15 -
 1:04:43
Chad Prather
15 hours agoTruth on Trial: When Fear Meets Faith
74.1K42 -
 LIVE
LIVE
LFA TV
14 hours agoLIVE & BREAKING NEWS! | WEDNESDAY 11/5/25
4,213 watching -
 1:57:16
The Chris Salcedo Show
15 hours ago $0.18 earnedDems Win In Dem States...And They Celebrate?
37.3K16 -
 1:04:43
Crypto Power Hour
13 hours ago $0.04 earnedPsychology Of Crypto Market Cycles
53.8K6 -
 9:58
9:58
Clintonjaws
12 days ago $0.31 earnedKaroline Leavitt's Response To 'The View' Host's Nasty Attacks Is Perfect
58.5K29 -
 24:23
24:23
World2Briggs
22 hours ago $0.05 earnedTop 10 Towns You Can Retire on $1900 a month in the Pacific North West.
42.3K10 -
 21:23
21:23
Lady Decade
19 hours ago $0.05 earnedThe Lost Sega Neptune Console Refuses To Die !
41.7K6