Create a control chart using Python 📊
#Python #ControlChart #StatisticalProcessControl
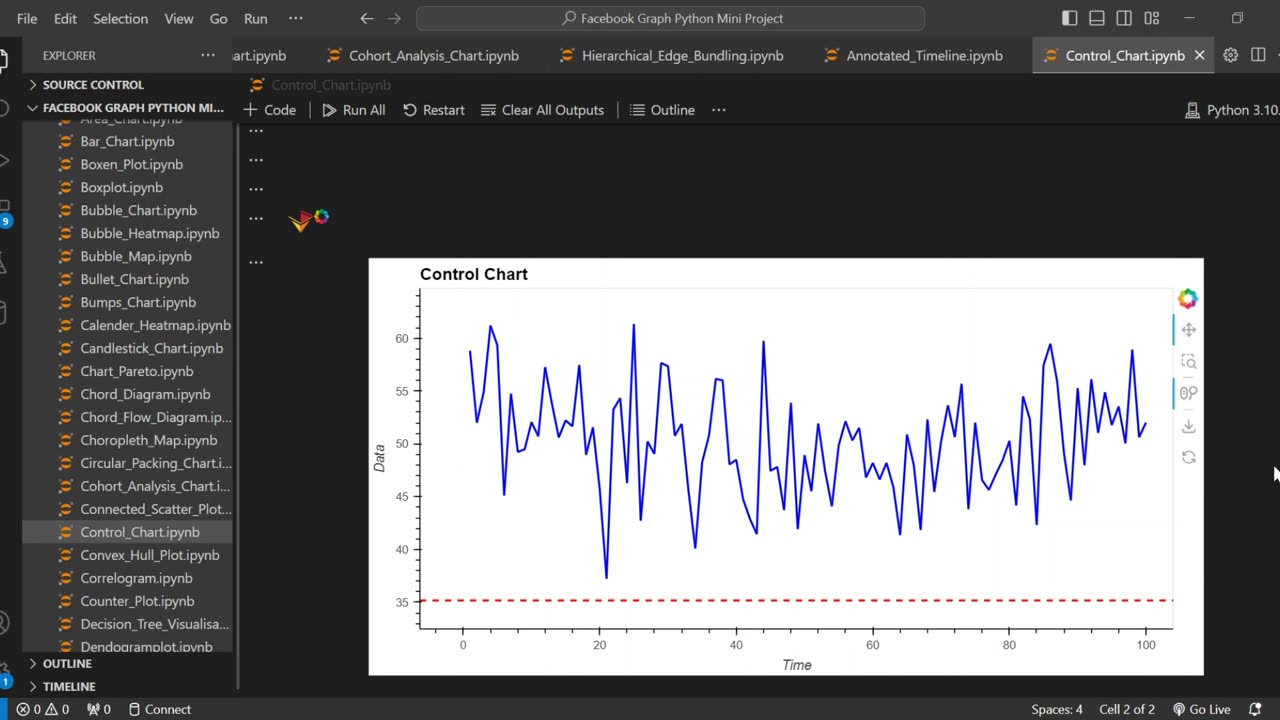
In this tutorial, I’ll show you how to create a Control Chart (also known as a Statistical Process Control (SPC) Chart) using Python. Control charts are essential for monitoring process stability and detecting variations in manufacturing, healthcare, finance, and more.
🔹 What You’ll Learn:
✔ How to generate synthetic process data using NumPy
✔ Calculating Upper Control Limit (UCL) and Lower Control Limit (LCL)
✔ Visualizing control charts with HoloViews and Bokeh for interactive plots
✔ Customizing the chart for better readability
👍 If you found this helpful, don’t forget to LIKE, SUBSCRIBE, and hit the NOTIFICATION BELL!
#Python #ControlChart #StatisticalProcessControl #HoloViews #DataVisualization
#SPC #QualityControl #PythonTutorial #DataScience #NumPy #Pandas
#Bokeh #SixSigma #LeanManufacturing #ProcessImprovement #Coding
-
 0:19
0:19
AI Evolutionary Technology
11 days agoCreate Turtle Graphics Using Python
81 -
 LIVE
LIVE
freecastle
6 hours agoTAKE UP YOUR CROSS- Love...Light...TRUTH!
176 watching -
 1:50:29
The Quartering
3 hours agoEpstein Victims To NAME People, Mutiny Over RFK Jr, Trump Turns On Warp Speed?
120K36 -
 LIVE
LIVE
Film Threat
21 hours agoMARVEL ZOMBIES! PLUS DEXTER RESURRECTION | Hollywood on the Rocks
86 watching -
 1:06:51
Jeff Ahern
2 hours ago $0.50 earnedNever Woke Wednesday with Jeff Ahern
12.5K -
 13:43
13:43
The Kevin Trudeau Show Limitless
7 hours agoClassified File 3 | Kevin Trudeau EXPOSES Secret Society Brainwave Training
24K4 -
 10:04
10:04
Freedom Frontline
4 hours agoBernie Sanders EXPLODES After Starbucks CEO FIRES BACK With Truth
2.77K6 -
 DVR
DVR
SportsPicks
4 hours agoCrick's Corner: Episode 75
7.91K -
 1:06:30
LindellTV
3 hours agoMIKE LINDELL LIVE AT THE WHITE HOUSE
18.3K -
 1:05:33
Russell Brand
5 hours agoTrump Goes NUCLEAR on China - accuses Xi of CONSPIRING against US with Putin & Kim - SF627
125K68