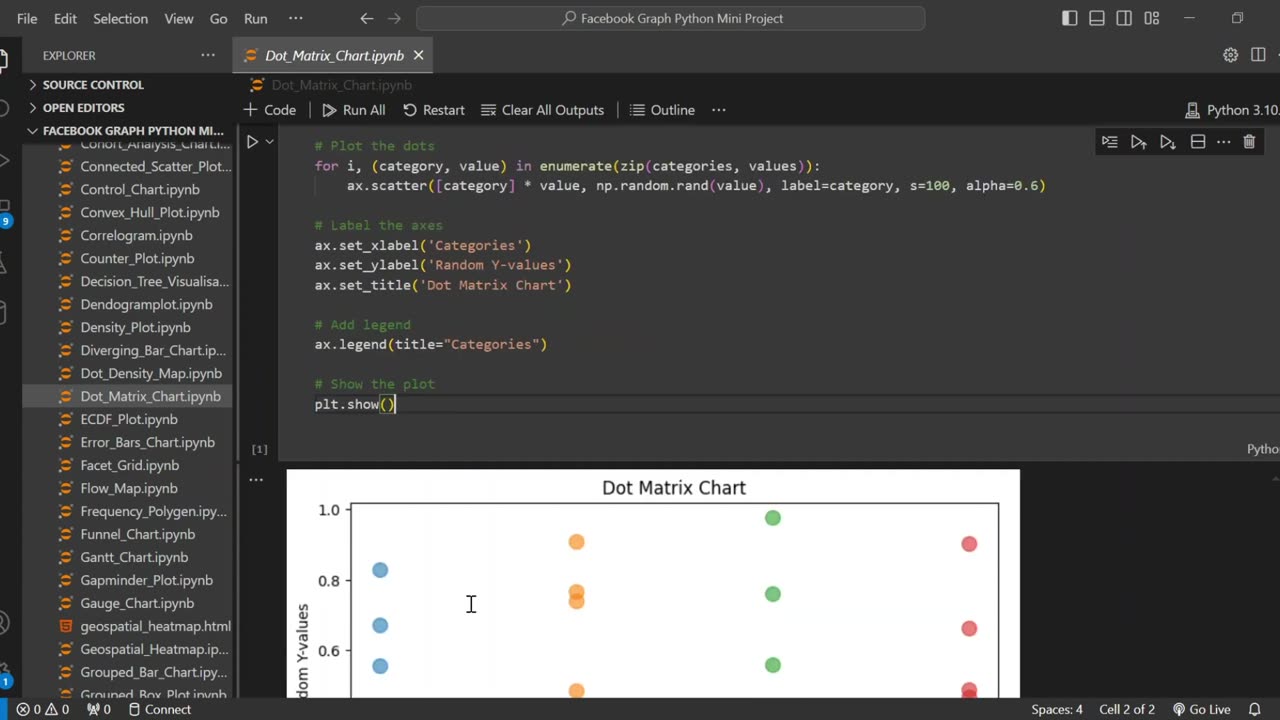
Create Stunning Dot Matrix Plots with Matplotlib 🎨📊✨
📊 Learn how to create professional Dot Matrix Plots using Python's Matplotlib! This step-by-step tutorial will teach you an innovative way to visualize category-based data that's more engaging than standard bar charts.
🔹 In this tutorial, you'll learn how to:
✅ Create a basic dot matrix plot from scratch
✅ Customize dot size, color, and transparency for better visualization
✅ Add proper labels, titles, and legends
✅ Use NumPy to generate random distributions
✅ Format your plot for professional presentations
🔔 Subscribe for more Python data visualization tutorials!
#Python #DataVisualization #Matplotlib #DotMatrixPlot
#DataScience #PythonTutorial #DataViz #PythonProgramming
#DataAnalysis #LearnPython #DataVisualizationTutorial
#MatplotlibTutorial #PythonForBeginners #TechTutorial
#AlternativeVisualizations #PythonCoding #DataPresentation
-
 0:20
0:20
AI Evolutionary Technology
1 month agoUsing Python to Analyze Your Internet Connection
121 -
 LIVE
LIVE
Steven Crowder
3 hours agoWho is the Real Myron Gaines | Ash Wednesday
44,264 watching -
 LIVE
LIVE
The Rubin Report
1 hour agoCharlie Kirk’s Warning for MAGA if Mamdani Won
3,128 watching -
 1:00:32
VINCE
3 hours agoNYC Has Been Seized By The Communists | Episode 162 - 11/05/25
138K168 -
 1:33:32
Graham Allen
3 hours agoTold You The War Was FAR From Over… The Blue Wave Just Proved It! Evil Is Fighting Back!
88.6K94 -
 LIVE
LIVE
Badlands Media
9 hours agoBadlands Daily: November 5, 2025
2,192 watching -
 3:01:00
Wendy Bell Radio
7 hours agoLike Sheep To Slaughter
73.6K100 -
 1:13:30
DML
3 hours agoDML LIVE: NYC Goes Socialist: Mamdani’s Victory
47.1K15 -
 1:04:43
Chad Prather
15 hours agoTruth on Trial: When Fear Meets Faith
74.1K42 -
 LIVE
LIVE
LFA TV
14 hours agoLIVE & BREAKING NEWS! | WEDNESDAY 11/5/25
4,199 watching