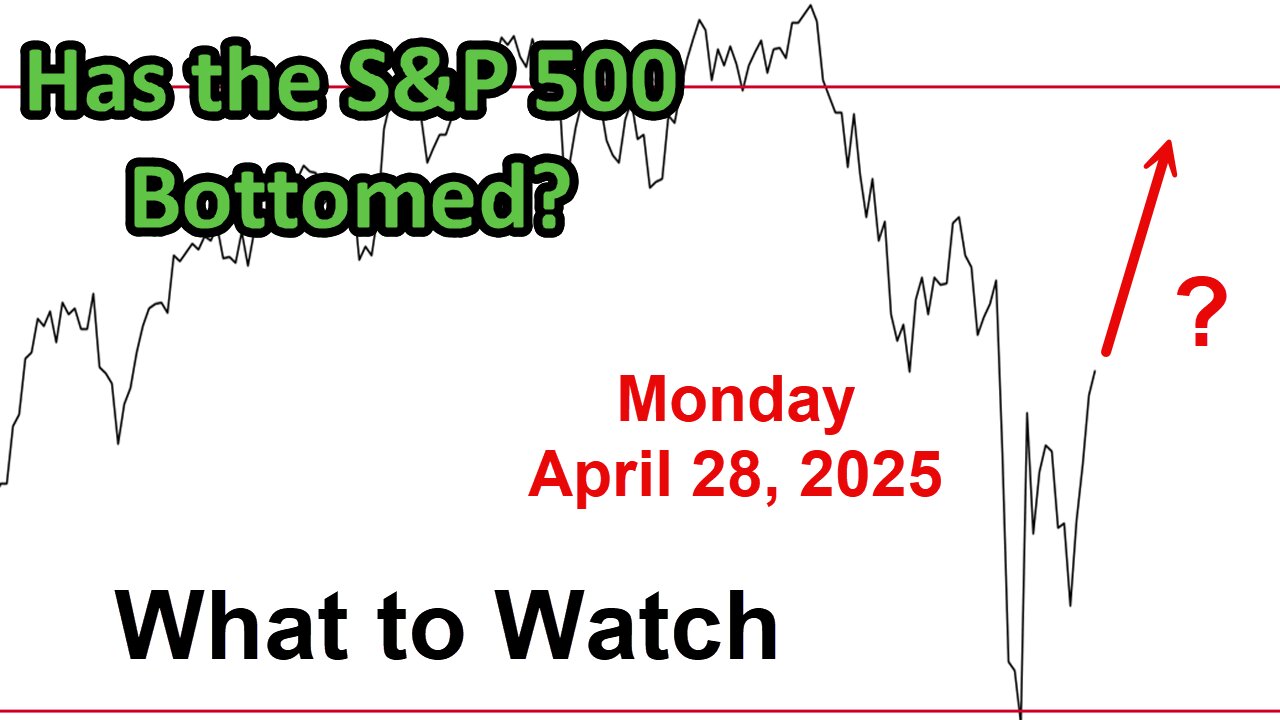
What to Watch for Monday April 28, 2025
Link to The SPX Investing Program https://spxinvesting.substack.com/
The What to Watch Update analyzes daily and weekly charts to assess the S&P 500's current market position, questioning whether it has bottomed after a strong week. The analysis categorizes indicators into positive, negative, and those to watch for potential market impact.
Positive Indicators:
S&P 500 Performance: The index saw a 400-point swing from Monday’s low of 5,100 to closing above 5,500 by Friday, showing late-day buying strength, particularly on Thursday, which displayed sustainable upward momentum. Key long-term indicators flipped positive post-Thursday.
Sentiment: Sentiment, extremely negative in April (below 25), is improving, now slightly above 25, suggesting a potential market low.
Growth vs. Value: Growth is outperforming value short-term, with intraday and end-of-day charts (e.g., Qs to SPY, discretionary to S&P) showing growth ratios above moving averages, a bullish sign.
Short-Term Trends: The S&P is above the 20-period simple and exponential moving averages, and double/triple exponential studies indicate a strengthening short-term trend.
Advance-Decline Studies: Both price and volume-based advance-decline lines for the S&P are positive, with short-term momentum oscillators (e.g., McClellan Oscillator) above zero.
The Smart Money Indicators: Accumulation/Distribution, Chaikin money flow, and Chaikin oscillator are all positive, reinforcing bullish signals.
Other Indicators: The Parabolic SAR (daily), vortex indicator, bullish percent index, and point-and-figure charts show positive price action. The Zweig NYSE Breadth Thrust triggered a buy signal, historically a strong bullish indicator.
Sector Ratios: Staples-to-S&P and staples-to-tech ratios are declining, indicating reduced defensiveness. Financials and semiconductors are showing signs of recovery.
Negative Indicators:
Intermediate and Long-Term Trends: Despite short-term gains, the intermediate and long-term trends remain negative, with the 50-period moving average below the 200-period for major indexes (S&P, Dow, NASDAQ, etc.).
ADX Trend Strength: The ADX indicates a weakening downtrend but remains negative, as the red line (bearish) is above the green line (bullish) in both short- and intermediate-term charts.
VIX: The VIX, though down from over 40 to below 25, remains above 20, signaling persistent market caution.
Individual Investor Sentiment: Investors have been extremely negative for nine weeks, an unusually prolonged period.
Growth vs. Value Ratios: While improving, S&P growth-to-value ratios are still below key moving averages, and discretionary-to-staples ratios show a recent death cross.
Sector Weakness: Semiconductors, homebuilders, transports, retail, and regional banks are in downtrends, though showing slight improvement. The FANG index is forming a death cross.
Stocks vs. Bonds: Ratios of stocks to bonds (e.g., S&P 1500 to short-term bonds) are below trendlines, suggesting recessionary concerns, though improving.
Market Correction: The S&P is still down over 10% from its February 2025 high, remaining in correction territory.
Indicators to Watch:
Employment: Weekly jobless claims are declining, and continuing claims are stable, with the upcoming May 2nd employment report critical.
Volume: Market volume is below average, which could be interpreted as either cautious participation or reduced selling pressure.
Interest Rates: The 10-year yield is stabilizing after a sharp rise, potentially benefiting stocks if it continues to decline.
Inflation Concerns: Cash-to-bonds and TIPS-to-bonds ratios show no major inflation fears, a positive for equities.
Yield Curve: The 10-year to 3-month yield curve is inverted, a recessionary signal, while the 10-year to 2-year is not.
Oil and Bonds: Oil prices are stable, and bond spreads (risky vs. safe) are narrowing, indicating reduced fear.
Mass Index and Pring Indicator: A potential mass index reversal signal and a Pring bottom fisher buy signal are noted but require confirmation.
Conclusion: The S&P 500 shows short-term bullish momentum, supported by positive price action, sentiment improvement, and growth outperforming value. However, intermediate and long-term trends remain negative, with technical damage and elevated VIX levels suggesting caution. The market is at the top of a trading range, slightly overextended short-term, and needs to break above the 5,575 pivot to confirm bullishness. Key areas to monitor include employment data, interest rates, and sector recoveries to gauge whether the market can sustain its recovery or risks further downside.
PDF of Charts and Slides used in today's video:
https://drive.google.com/file/d/1WFYk6hdbLin2chk1685nZ5BAO7i6FeZe/view?usp=sharing
DISCLAIMER This video is for entertainment purposes only. I am not a financial adviser, and you should do your own research and go through your own thought process before investing in a position. Trading is risky!
-
 41:41
41:41
The SPX Investing Program
4 days agoS&P 500 Weekly Update for August 25-29, 2025
18 -
 LIVE
LIVE
SavageJayGatsby
22 hours agoFirst Rumble Exclusive Stream?! | Let's Play: Prey | $300 Weekly Goal for Spicy Bite Saturday
55 watching -
 LIVE
LIVE
GritsGG
10 hours agoWin Streaking! Most Wins 3485+ 🧠
105 watching -
 LIVE
LIVE
Quite Frankly
5 hours ago"Mixed News, RFK Pull-up Challenge, Calls" ft. J Gulinello 8/28/25
186 watching -
 1:14:52
TheCrucible
2 hours agoThe Extravaganza! EP: 29 (8/28/25)
69.5K7 -
 1:09:58
Kim Iversen
3 hours agoTrans. Russian. Anti-Israel. Anti-Trump. Are You Buying This Story?
18.1K43 -
 1:51:08
Redacted News
3 hours agoEMERGENCY! BILL GATES CULT MEMBERS FOUND PLANTED INSIDE MULTIPLE FEDERAL AGENCIES, RFK FURIOUS
113K73 -
 31:02
31:02
Kimberly Guilfoyle
4 hours agoFull Breaking News Coverage: Live with John Nantz & Steve Moore | Ep250
20.4K11 -
 1:15:19
vivafrei
5 hours agoShameless Politicization of Tragedy! Susan Monarez is OUT! Pritzker is an IDIOT! & MORE!
118K46 -
 9:52
9:52
Tundra Tactical
2 hours agoCracker Meme Review On Tundra Meme Review!!
3.52K