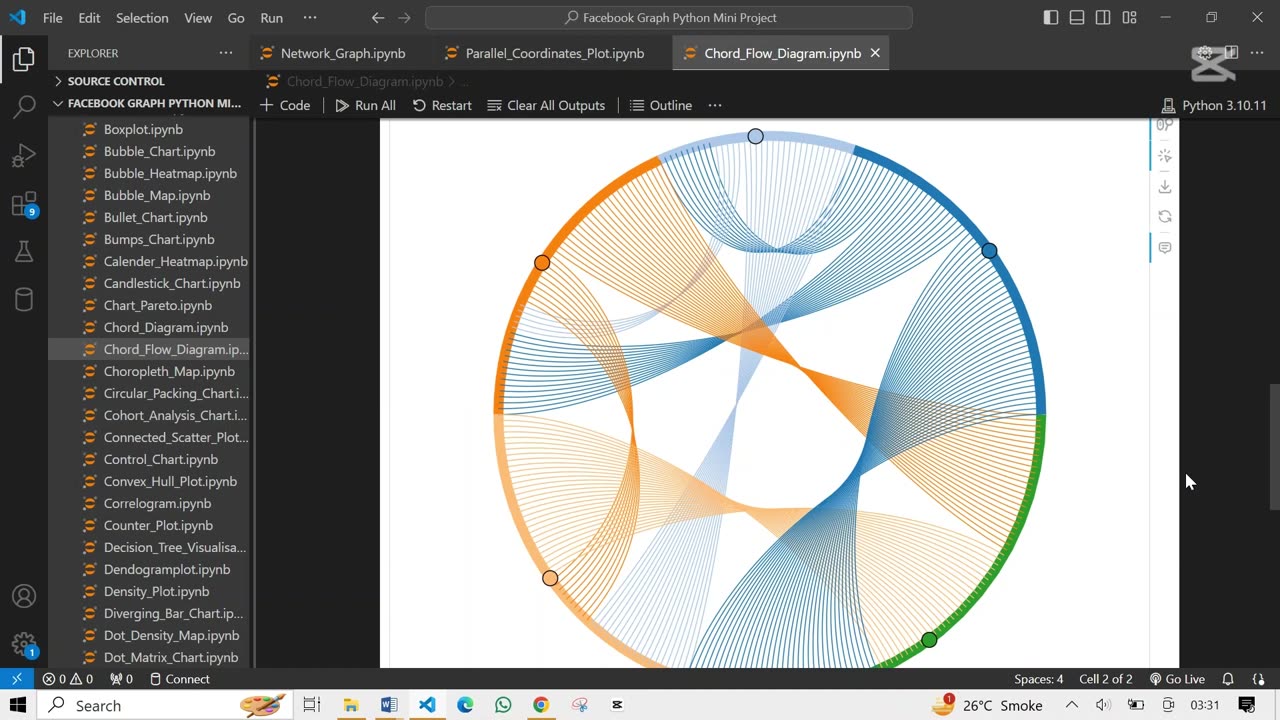
Create Interactive Chord Diagram Using Python 🎶
In this step-by-step tutorial, I’ll show you how to build beautiful, interactive chord diagrams using Python. Perfect for visualizing network flows, relationships, and complex data connections—whether for analytics, research, or just cool visualizations!
📌 What You’ll Learn:
✔️ How to set up HoloViews & Bokeh for Python visualizations
✔️ Transform raw data into a stunning chord diagram
✔️ Customize colors, labels, and interactivity
✔️ Practical examples for real-world use cases
👍 Like, Subscribe & Hit the Bell Icon for more Python & data science tutorials!
#Python #ChordDiagram #DataVisualization #PythonTutorial #HoloViews #Bokeh #NetworkGraph #InteractivePlots #DataScience #PythonPlotting #DataFlows #PythonForBeginners #AdvancedPython #NetworkVisualization #ChordFlow #Pandas #PythonHoloViews #DataAnalysis #StepByStepPython #CodingTutorial #PythonCharts
-
 0:16
0:16
AI Evolutionary Technology
1 month agoCreate Email Check Account Services Using Python
9 -
 34:49
34:49
Stephen Gardner
2 hours ago🔥Trump DROPS Secret Plan – Democrats Left SPEECHLESS!
2.34K21 -
 1:10:42
vivafrei
2 hours agoThomas Crooks Exposé is a BOMBSHELL! Epstein Drama Continues! Alexis Wilkins Streisand Effect & More
95.5K43 -
 1:41:04
The Quartering
3 hours agoEpstein Files Takes Its First Scalp, MTG Unleashes, Kash Patel Blasted, Internet Outage & More
104K74 -
 LIVE
LIVE
Dr Disrespect
6 hours ago🔴LIVE - DR DISRESPECT - ARC RAIDERS - NO MERCY TO MAX LEVEL
1,595 watching -
 24:53
24:53
Jasmin Laine
1 hour ago“NO ONE BELIEVES YOU”—Carney Gets HUMILIATED in BRUTAL Showdown
548 -
 LIVE
LIVE
LFA TV
19 hours agoLIVE & BREAKING NEWS! | TUESDAY 11/18/25
1,385 watching -
 LIVE
LIVE
freecastle
6 hours agoTAKE UP YOUR CROSS- The fear of the LORD begins knowledge; Fools despise WISDOM and INSTRUCTION.
62 watching -
 5:16
5:16
Buddy Brown
4 hours ago $1.19 earnedWatch INSANE Video of Woman Denied a TINY HOME on 37 Acres! | Buddy Brown
4.14K6 -
 59:19
59:19
Professor Nez
3 hours ago🔥 Trump TORCHES ABC Reporter for Disrespecting Saudi Crown Prince Mohammed bin Salman! (WOW!)
19.1K18