Create the Dot Density Map using Python 🗺️🐍
6 months ago
24
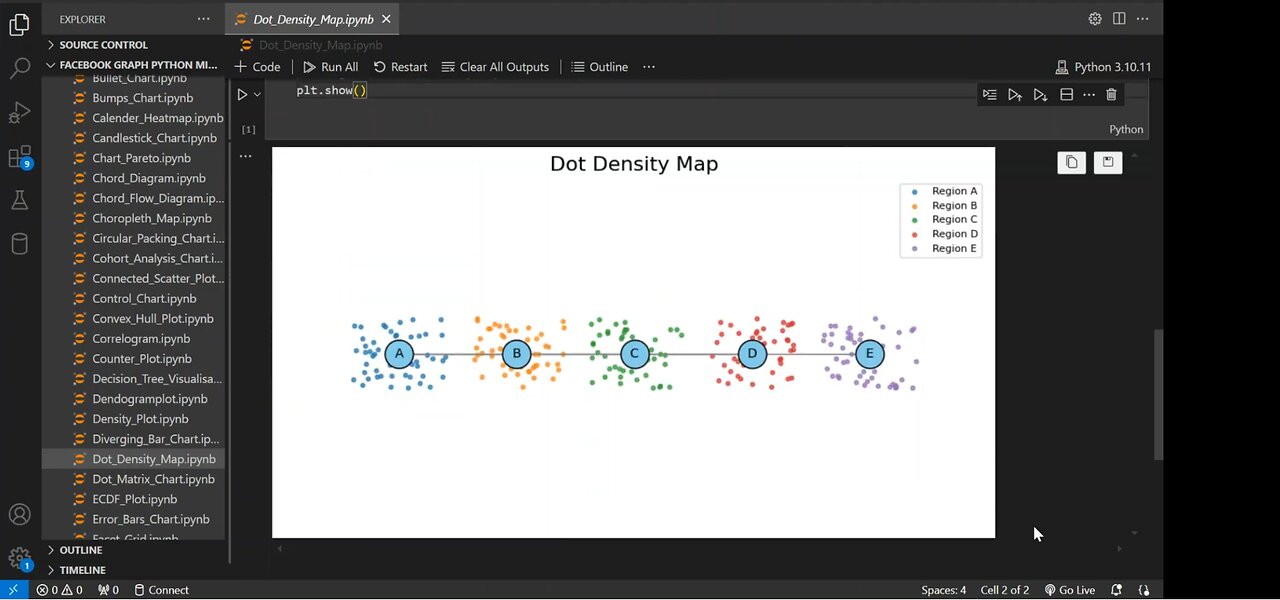
Dot density maps are a powerful way to visualize data distribution across different regions. In this step-by-step guide, we'll:
✅ Build a Network Graph using NetworkX
✅ Generate Random Dots to represent density in each region
✅ Customize the Visualization with colors, labels, and styling
✅ Combine Graph & Dot Density for an informative data representation
🔔 Subscribe for more Python & Data Science tutorials!
#Python #DataVisualization #NetworkX #Matplotlib #DotDensityMap
#PythonTutorial #DataScience #GraphTheory #PythonProgramming
#CodingTutorial #DataAnalysis #NetworkGraph #PythonForBeginners
#VisualizationTutorial #LearnPython #TechTutorial
Loading 1 comment...
-
 1:02
1:02
AI Evolutionary Technology
1 month agoLive Weather App in Python | BeautifulSoup & Web Scraping Tutorial
81 -
 3:01:00
Wendy Bell Radio
7 hours agoLike Sheep To Slaughter
73.6K100 -
 1:13:30
DML
3 hours agoDML LIVE: NYC Goes Socialist: Mamdani’s Victory
47.1K15 -
 1:04:43
Chad Prather
15 hours agoTruth on Trial: When Fear Meets Faith
74.1K42 -
 LIVE
LIVE
LFA TV
14 hours agoLIVE & BREAKING NEWS! | WEDNESDAY 11/5/25
4,199 watching -
 1:57:16
The Chris Salcedo Show
15 hours ago $0.18 earnedDems Win In Dem States...And They Celebrate?
37.3K16 -
 1:04:43
Crypto Power Hour
13 hours ago $0.04 earnedPsychology Of Crypto Market Cycles
53.8K6 -
 9:58
9:58
Clintonjaws
12 days ago $0.31 earnedKaroline Leavitt's Response To 'The View' Host's Nasty Attacks Is Perfect
58.5K29 -
 24:23
24:23
World2Briggs
22 hours ago $0.05 earnedTop 10 Towns You Can Retire on $1900 a month in the Pacific North West.
42.3K10 -
 21:23
21:23
Lady Decade
19 hours ago $0.05 earnedThe Lost Sega Neptune Console Refuses To Die !
41.7K6