
How to Create a Bump Chart in Python 🐍 with Matplotlib 📊 & Pandas 🐼
📊 How to Create a Bump Chart in Python with Matplotlib & Pandas | Data Visualization Tutorial
In this tutorial, you’ll learn how to create a Bump Chart in Python using Matplotlib and Pandas—a powerful way to visualize ranking changes over time! Whether you're analyzing sales performance, sports rankings, or survey results, Bump Charts help you track how categories rise and fall across different periods.
🔹 What You’ll Learn:
✅ How to prepare and structure your data for a Bump Chart
✅ Step-by-step code walkthrough using Pandas & Matplotlib
✅ Customizing colors, labels, and gridlines for a polished look
✅ Adding annotations to highlight key ranking changes
👍 Enjoyed the tutorial? Don’t forget to Like, Subscribe, and hit the Bell Icon for more Python & data science content!
💬 Got questions? Drop them in the comments—I’d love to help!
#Python #DataVisualization #BumpChart #Matplotlib #Pandas #DataScience #PythonTutorial #DataAnalysis #Coding #RankingChart #programming #graphvisualization #datascience #coding
-
 0:16
0:16
AI Evolutionary Technology
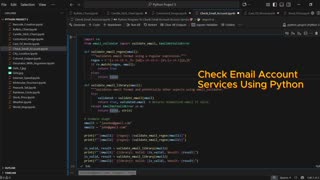
1 month agoCreate Email Check Account Services Using Python
9 -
 18:08
18:08
Professor Nez
4 hours ago🚨HOLY CRAP: Members of Congress Call for Military INSURRECTION!
96.5K71 -
 4:14:26
Grant Cardone
6 hours agoHow to Buy Real Estate With NO Money Down (LIVE Training With Grant Cardone)
95.1K5 -
 1:56:11
AlaskanBallistics
13 hours ago $1.66 earnedShooting the WhisperStrike WT30 Live!
14.2K -
 19:53
19:53
MetatronHistory
20 hours agoRome VS Greece - Ultimate Clash of Civilizations Explained
49.6K13 -
 LIVE
LIVE
The Big Mig™
6 hours agoThe Big Mig Show's Greatest Hits w/ Americas Future, Karmageddon, Operation Gideon,..
186 watching -
 1:32:33
VapinGamers
5 hours ago $5.95 earnedTools of the Trade - EP12 The Art of Story Telling with MidnightinTheMountains - !rumbot !music
34.9K2 -
 3:09:50
SOLTEKGG
5 hours ago🔴LIVE - Battlefield 6 - Going Pro in RED SEC
33.5K1 -
 5:19:03
Midnight In The Mountains™
6 hours agoThe Midnights Play Arc Raiders | Loot Scoot and KILL | Crypto Wallet up n running GO JOIN THE BETA!
26.1K4 -
 53:25
53:25
X22 Report
8 hours agoMr & Mrs X - Trump Is Using The Same Tactic As Our Founding Fathers To Rebuild America - EP 17
102K37