Create a Choropleth Map with Python 🐍 & Plotly Express 🗺️✨
#Python #Pandas #Map
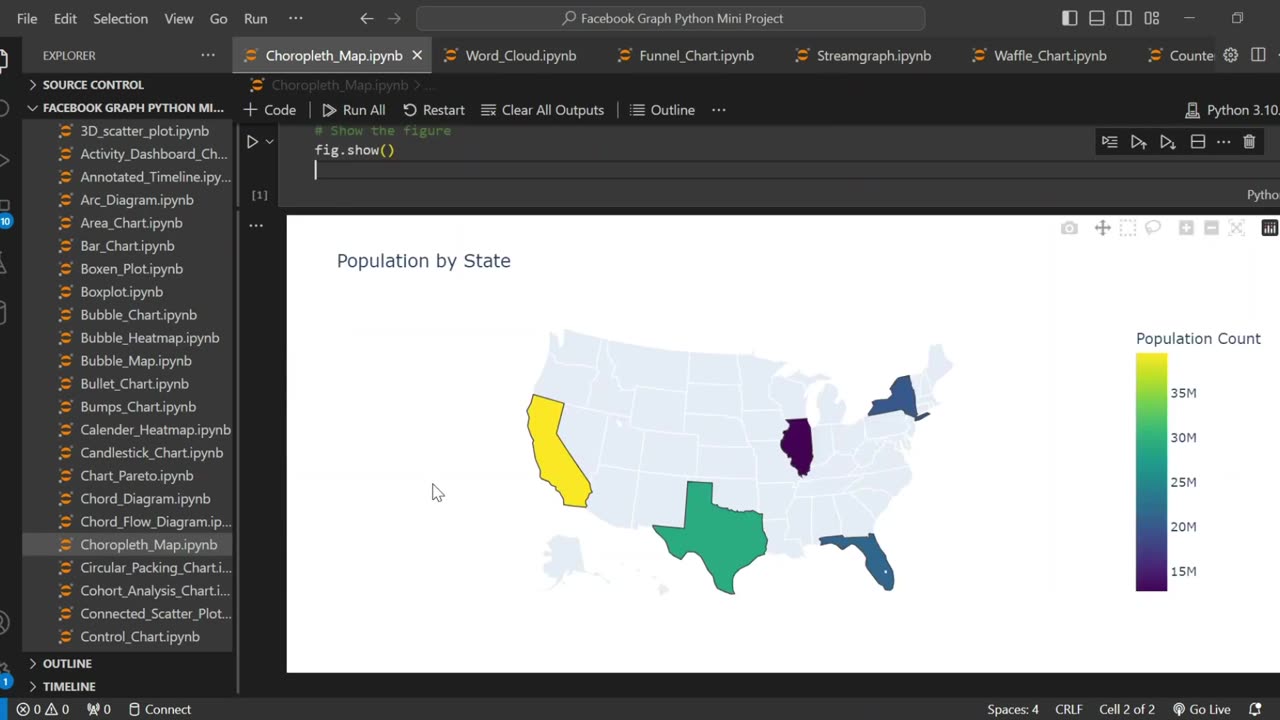
In this tutorial, I’ll show you how to create a professional choropleth map using Python and Plotly Express. Whether you're visualizing population data, election results, or regional trends, this step-by-step guide will help you build an interactive and visually appealing map with just a few lines of code!
🔹 What You’ll Learn:
✅ How to prepare data for a choropleth map using Pandas
✅ Using Plotly Express to create an interactive state-level map
✅ Customizing colors, labels, and titles for better visualization
✅ Displaying population data (or any metric) with color gradients
🚀 Perfect for:
Data analysts & scientists
Python beginners learning visualization
Anyone interested in geospatial data
🔔 Subscribe for more Python & data science tutorials!
👍 Like & Comment if you found this helpful!
#Python #DataVisualization #ChoroplethMap #PlotlyExpress #DataScience #PythonTutorial #DataAnalysis #Geospatial #Coding #LearnPython #Pandas #DataViz #Map #TechTutorial
-
 0:17
0:17
AI Evolutionary Technology
2 months agoVisualizing Molecular Structure From SMILES Using RDKit 🧪
5 -
 1:56:11
AlaskanBallistics
13 hours ago $1.66 earnedShooting the WhisperStrike WT30 Live!
14.2K -
 19:53
19:53
MetatronHistory
20 hours agoRome VS Greece - Ultimate Clash of Civilizations Explained
49.6K13 -
 LIVE
LIVE
The Big Mig™
6 hours agoThe Big Mig Show's Greatest Hits w/ Americas Future, Karmageddon, Operation Gideon,..
186 watching -
 1:32:33
VapinGamers
5 hours ago $5.95 earnedTools of the Trade - EP12 The Art of Story Telling with MidnightinTheMountains - !rumbot !music
34.9K2 -
 3:09:50
SOLTEKGG
5 hours ago🔴LIVE - Battlefield 6 - Going Pro in RED SEC
33.5K1 -
 5:19:03
Midnight In The Mountains™
6 hours agoThe Midnights Play Arc Raiders | Loot Scoot and KILL | Crypto Wallet up n running GO JOIN THE BETA!
26.1K4 -
 53:25
53:25
X22 Report
8 hours agoMr & Mrs X - Trump Is Using The Same Tactic As Our Founding Fathers To Rebuild America - EP 17
102K37 -
 3:15:31
PudgeTV
4 hours ago🟣 Arc Raiders - Gaming on Rumble | Going Topside w My Daughter’s Husband
18.9K1 -
 2:05:43
LFA TV
1 day agoRUMBLE RUNDOWN WEEK 7 with SHAWN FARASH 11.22.25 9AM
152K14