Create a Speedometer Gauge Chart in Python Using Plotly 📊🐍
#Python #Plotly #DataVisualization
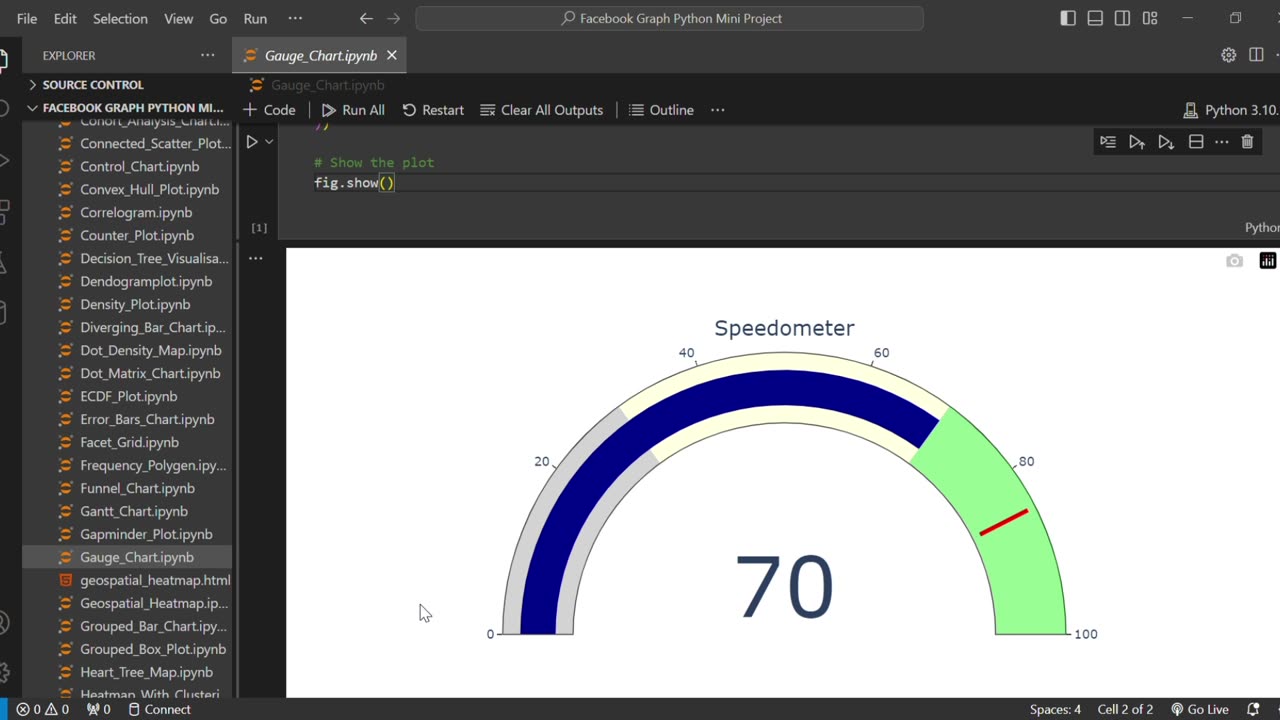
Want to visualize your data in a more interactive and engaging way? In this video, you'll learn how to create a Speedometer-style Gauge Chart using Plotly in Python – step-by-step!
We’ll cover: ✅ Creating a gauge chart using plotly.graph_objects
✅ Customizing color zones (gray, yellow, green)
✅ Adding threshold indicators
✅ Making your charts look clean and professional
This tutorial is perfect for beginners and data visualization enthusiasts looking to build modern dashboards and indicators in Python.
🔔 Don’t forget to Like, Comment, and Subscribe for more Python & Data Visualization tutorials!
#Python #Plotly #DataVisualization #Dashboard #GaugeChart #PythonTutorial #Python #Plotly #DataVisualization #GaugeChart
#SpeedometerChart #PythonDashboard #PythonPlotly #PlotlyTutorial
#PythonBeginner #PlotlyIndicator #PythonDataScience #PythonVisualization #CreateGaugeChart #PythonGraph
#DashboardInPython
-
 0:17
0:17
AI Evolutionary Technology
2 months agoVisualizing Molecular Structure From SMILES Using RDKit 🧪
5 -
 LIVE
LIVE
SOLTEKGG
38 minutes ago🔴LIVE - Battlefield 6 - Going Pro in RED SEC
86 watching -
 LIVE
LIVE
Midnight In The Mountains™
2 hours agoThe Midnights Play Arc Raiders | Loot Scoot and KILL | Crypto Wallet up n running GO JOIN THE BETA!
105 watching -
 53:25
53:25
X22 Report
3 hours agoMr & Mrs X - Trump Is Using The Same Tactic As Our Founding Fathers To Rebuild America - EP 17
54.9K10 -
 LIVE
LIVE
PudgeTV
31 minutes ago🟣 Arc Raiders - Gaming on Rumble | Going Topside w My Daughter’s Husband
72 watching -
 2:05:43
LFA TV
20 hours agoRUMBLE RUNDOWN WEEK 7 with SHAWN FARASH 11.22.25 9AM
115K6 -
 LIVE
LIVE
ttvglamourx
1 hour agoGLAMOURX VS CALL OF DUTY LOBBIES !DISCORD
204 watching -
 LIVE
LIVE
DannyStreams
3 hours agoSaturday Morning Tarky
94 watching -
 1:12:53
Wendy Bell Radio
6 hours agoPet Talk With The Pet Doc
18.8K20 -
 LIVE
LIVE
CHiLi XDD
1 hour agoFF7 Remake | Materia Hunting at its finest!
97 watching