Create a Speedometer Gauge Chart in Python Using Plotly 📊🐍
#Python #Plotly #DataVisualization
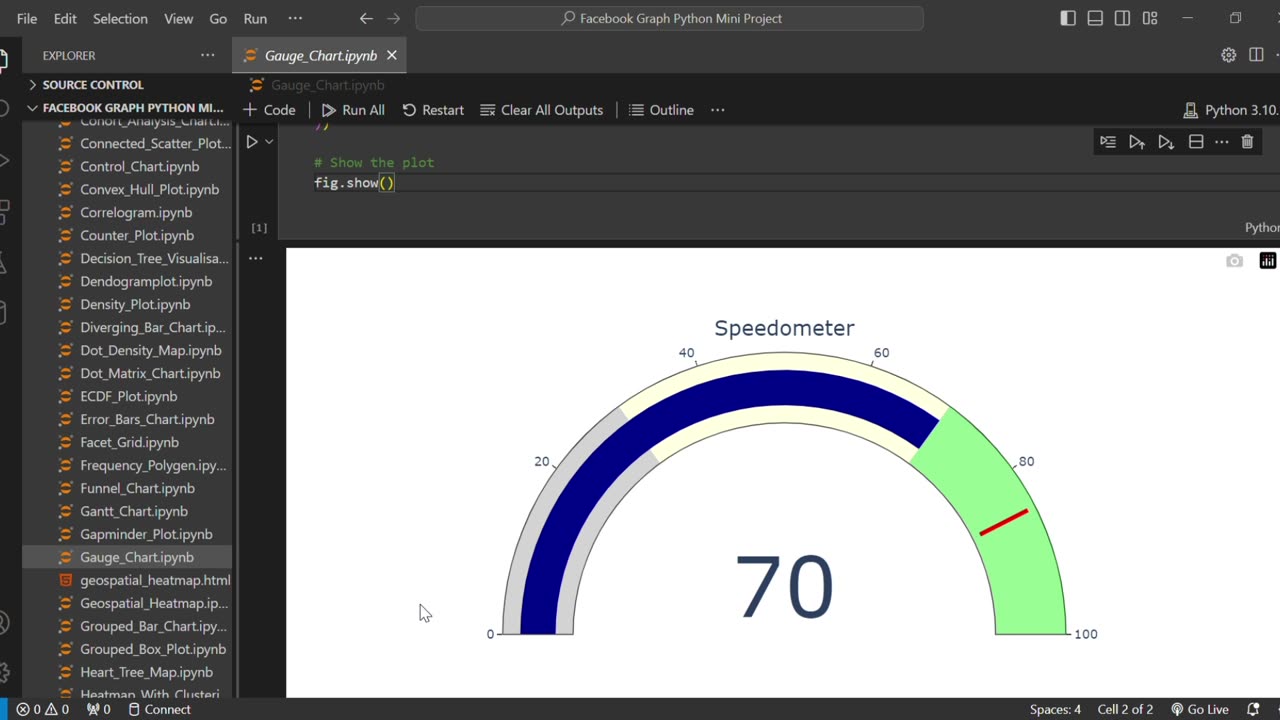
Want to visualize your data in a more interactive and engaging way? In this video, you'll learn how to create a Speedometer-style Gauge Chart using Plotly in Python – step-by-step!
We’ll cover: ✅ Creating a gauge chart using plotly.graph_objects
✅ Customizing color zones (gray, yellow, green)
✅ Adding threshold indicators
✅ Making your charts look clean and professional
This tutorial is perfect for beginners and data visualization enthusiasts looking to build modern dashboards and indicators in Python.
🔔 Don’t forget to Like, Comment, and Subscribe for more Python & Data Visualization tutorials!
#Python #Plotly #DataVisualization #Dashboard #GaugeChart #PythonTutorial #Python #Plotly #DataVisualization #GaugeChart
#SpeedometerChart #PythonDashboard #PythonPlotly #PlotlyTutorial
#PythonBeginner #PlotlyIndicator #PythonDataScience #PythonVisualization #CreateGaugeChart #PythonGraph
#DashboardInPython
-
 0:18
0:18
AI Evolutionary Technology
1 month ago💰 Simple Currency Converter App in Python
20 -
 1:33:32
Graham Allen
3 hours agoTold You The War Was FAR From Over… The Blue Wave Just Proved It! Evil Is Fighting Back!
88.6K94 -
 LIVE
LIVE
Badlands Media
9 hours agoBadlands Daily: November 5, 2025
2,193 watching -
 3:01:00
Wendy Bell Radio
7 hours agoLike Sheep To Slaughter
73.6K100 -
 1:13:30
DML
3 hours agoDML LIVE: NYC Goes Socialist: Mamdani’s Victory
47.1K15 -
 1:04:43
Chad Prather
15 hours agoTruth on Trial: When Fear Meets Faith
74.1K42 -
 LIVE
LIVE
LFA TV
14 hours agoLIVE & BREAKING NEWS! | WEDNESDAY 11/5/25
4,213 watching -
 1:57:16
The Chris Salcedo Show
15 hours ago $0.18 earnedDems Win In Dem States...And They Celebrate?
37.3K16 -
 1:04:43
Crypto Power Hour
13 hours ago $0.04 earnedPsychology Of Crypto Market Cycles
53.8K6 -
 9:58
9:58
Clintonjaws
12 days ago $0.31 earnedKaroline Leavitt's Response To 'The View' Host's Nasty Attacks Is Perfect
58.5K29