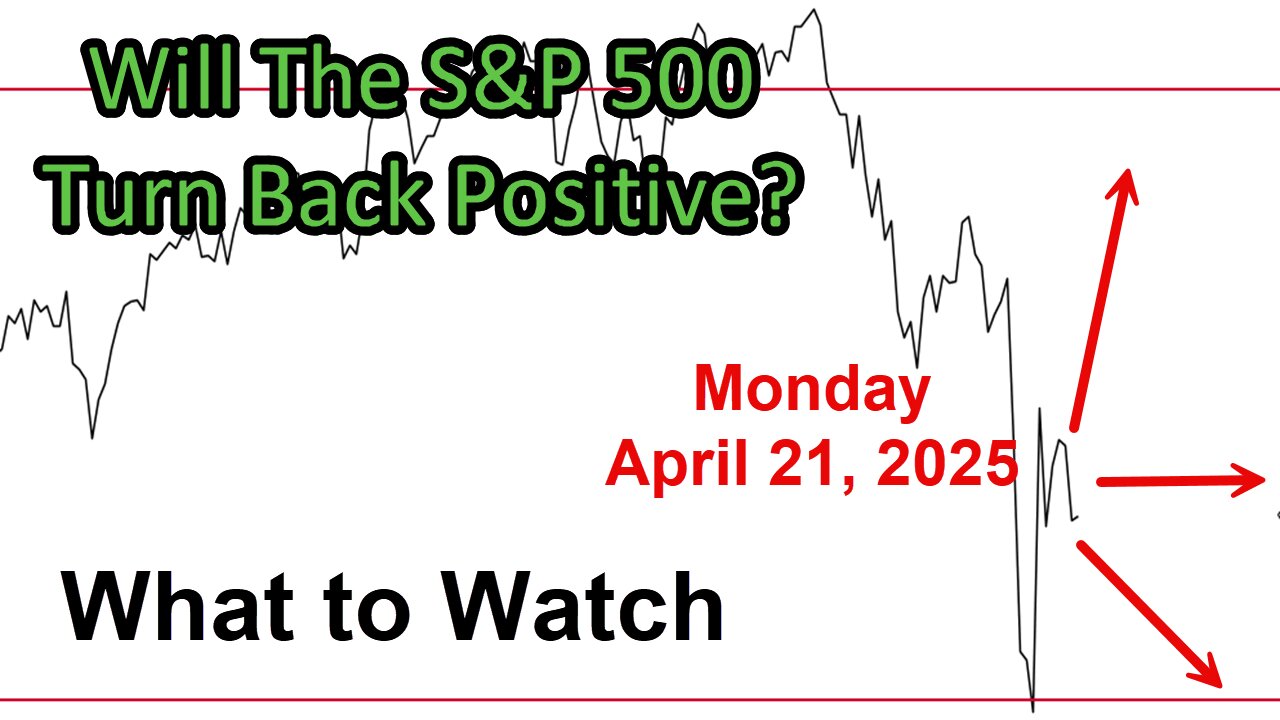
What to Watch Update for Monday April 21, 2025
Link to The SPX Investing Program https://spxinvesting.substack.com/
The What to Watch Update summarizes market trends by analyzing charts from the past week, categorizing them into positive, negative, and watchlist indicators.
Here's a concise summary:
Market Overview: Major indexes (Dow, NASDAQ, NASDAQ 100, S&P 500, mid-caps, small-caps) are all in downtrends, confirmed by moving average crossovers, but not yet in a bear market (requires a 20% drop from the February 19th high). The market is in a corrective phase (10-20% decline).
Positive Indicators:
S&P McClellan Oscillator: Moved above zero on Thursday, showing slight positivity.
Swenlin Trading Oscillator**: Rising, based on price and volume, above the midpoint.
Bullish Percent Indexes: Rebounded from extreme negative, now above the moving average.
Long-term Support: S&P 500 has held above the 50% Fibonacci retracement (2022 low to 2025 high) and is above the 38.2% level. Weekly S&P chart is holding above the S1 level, and the trend channel from 2009 remains above the midpoint.
VIX: Declining from high levels, with MACD momentum shifting positively for stocks. However, the VIX remains above 20.
NASDAQ 100 Momentum: PPO above the moving average, indicating a slight improvement.
Ratios: NASDAQ 100 vs. small-caps and financials vs. S&P 500 holding up, suggesting relative strength.
Negative Indicators:
Sentiment Gauges: Investor's Intelligence: Extreme negative sentiment could act as a contrarian bullish signal. Individual investors have been bearish for eight weeks, with fear levels persistently below 25.
VIX: Still above 20, indicating ongoing market stress.
Risk Ratios: Risk-on/risk-off and high-beta vs. low-beta ratios declining, showing a continued defensive market shift.
Growth vs. Value: Growth underperforming value, signaling negativity.
Moving Averages: 50-period crossed below 200-period, confirming downtrends across indexes.
Advance-Decline Line: Mixed, but volume-based is below the moving average, leaning negative.
Trend (ADX): Negative across short, intermediate, and long-term.
Smart Money Indicators: Chaikin Money Flow and Oscillator are negative; Accumulation/Distribution is ambiguous but leans negative.
Vortex and Moving Averages: Red line above green (negative), and prices below all moving averages.
Rate of Change: Extreme negative over 50 periods, with no sustained bounce above -10%.
Parabolic SAR: Negative on the weekly chart, though positive on the daily.
Death Crosses: Confirmed in Dow, NASDAQ, NASDAQ 100, small-caps, mid-caps, micro-caps, Wilshire 5000, and total US stock ETF.
Sector Weakness: Financials dropping below the 200-day moving average, regional banks underperforming, semiconductors in a downtrend, and staples outperforming tech and S&P (defensive shift).
Stocks vs. Bonds: Bonds outperforming stocks, suggesting recession fears (hard landing).
Long-term Trends: NASDAQ 100 dropping further below a 2009 trend line; staples-to-S&P ratio declining, reminiscent of 2021 pre-bear market signals.
Watchlist:
Employment: Weekly jobless claims dropped, and continuing claims are range-bound, reducing recession fears for now.
Interest Rates: Stabilizing after a sharp rise, with potential to support stocks if they decline further.
Inflation Expectations: Ratios (cash vs. bonds, TIPS vs. bonds) suggest the market is not overly concerned about inflation or rising rates.
Yield Curve: 10-year to 3-month yield curve is not inverted, restarting a recession countdown.
Bond Spreads: Junk vs. high-grade bond spreads improving, indicating slightly less fear.
Oil: Rising to mid-60s, under observation.
US Dollar: In a downtrend (daily and weekly death crosses), potentially manipulated to devalue debt, despite tariff talks.
Conclusion: The market is predominantly negative, with all major indexes in downtrends and defensive sectors outperforming. Some positive indicators (e.g., McClellan Oscillator, long-term support) and contrarian sentiment suggest potential for a bounce, but the weight of negative signals (death crosses, declining ratios, smart money indicators) dominates. Employment and inflation numbers are stable, but recession risks linger if trends worsen.
PDF of Charts and Slides used in today's video:
https://drive.google.com/file/d/1XBSjp7yfH42naXGjX4f9oWrH5TY9YLdq/view?usp=sharing
My Exclusive Free Workshop: The Four P's of Building a Successful Investing Program → https://spxinvesting.mailchimpsites.com
Facebook Private Group:
https://www.facebook.com/groups/667271964721864
DISCLAIMER This video is for entertainment purposes only. I am not a financial adviser, and you should do your own research and go through your own thought process before investing in a position. Trading is risky!
-
 41:07
41:07
The SPX Investing Program
5 days ago $0.02 earnedWhat to Watch Update for August 18-22, 2025
351 -
 15:27
15:27
robbijan
1 day ago $2.31 earnedThe Emperor’s New Labubu & The Spiritual War Behind Everything
31.3K37 -
 LIVE
LIVE
GritsGG
15 hours ago36 Hour Stream! Most Wins 3420+ 🧠
248 watching -
 2:05:47
TimcastIRL
4 hours agoTrump FBI Raids John Bolton Amid Classified Docs Investigation | Timcast IRL
153K49 -
 2:15:23
TheSaltyCracker
4 hours agoFinally Someone Gets Raided ReEEeStream 8-22-25
64.5K182 -
 LIVE
LIVE
I_Came_With_Fire_Podcast
16 hours agoChina's New Ship Killers, EU Dead, Shooter HOAX, and The Missing Woman
180 watching -
 LIVE
LIVE
SynthTrax & DJ Cheezus Livestreams
13 hours agoFriday Night Synthwave 80s 90s Electronica and more DJ MIX Livestream OUTSIDERZ Edition
152 watching -
 LIVE
LIVE
VapinGamers
3 hours ago $0.01 earnedFortnite Friday with BrianZGame and Community! #1 Controller Scrub NA - !rumbot !music
45 watching -
 LIVE
LIVE
iCheapshot
4 hours ago $0.01 earnedTrying Out The Finals | Complete Newb
23 watching -
 1:59:06
HogansAlleyHero
6 hours ago💥2XP WEEKEND - BF6 REWARDS UNLOCK GRIND 💥
2.4K