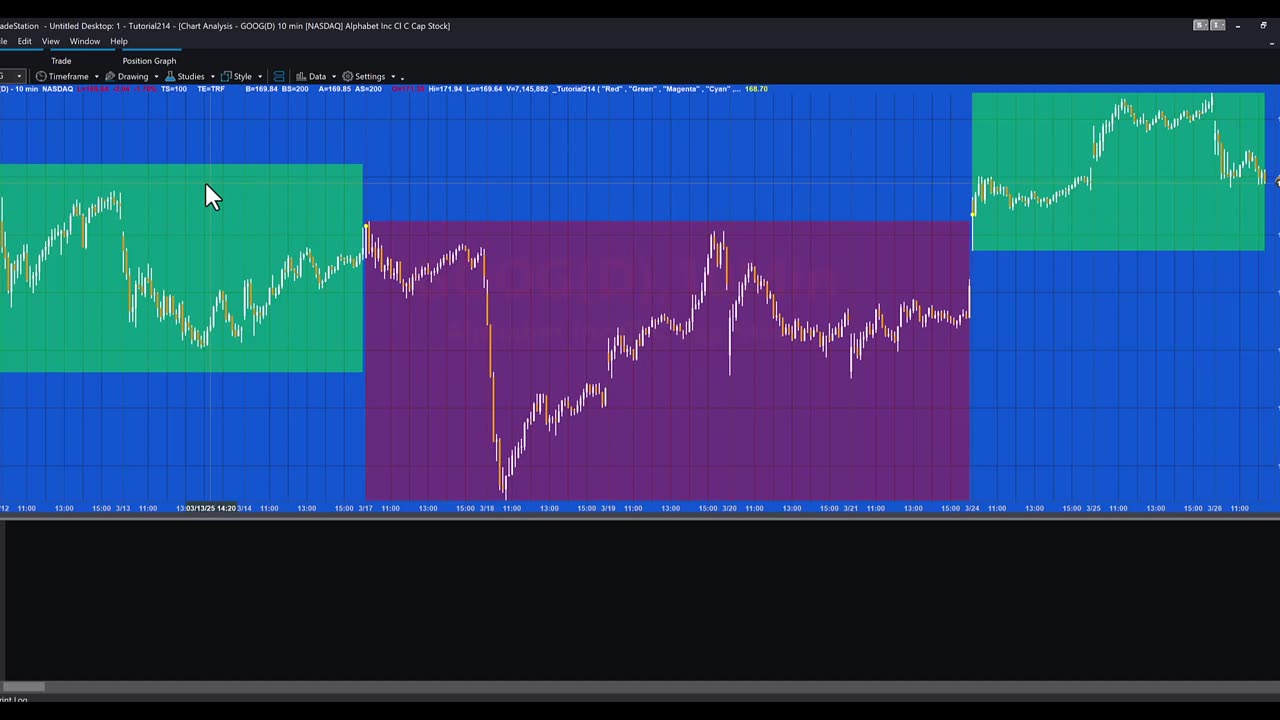
Tutorial 214 | Draw a rectangle between the high and low of the week
Tutorial 214 explains how to draw a rectangle on a chart each week between the highest high and the lowest low of the week. The tutorial is similar to tutorial 212 which drew boxes for the highest high and lowest low of the DAY rather than the week.
The rectangles for completed weeks in the past are drawn at the end of the week from the last bar of the previous week to the first bar of the previous week.
The present week is drawn from the last bar on the chart and is extended as new bars are added to the chart. At the end of the week this rectangle is deleted.
Among the various programming topics covered in the tutorial are how to:
convert dates and time to DateTime format
create DateTime points
find the week number
create a method to draw a rectangle (DrawRectangle)
create a method to change the fill color of a rectangle (ColorRectangle)
The color of the rectangles is based on the highest high and lowest low of the current and previous weeks.
-
 1:47:18
Steven Crowder
3 hours agoTo Execute or Not to Execute: Trump Flips the Dems Sedition Playbook Back at Them
184K201 -
 16:11
16:11
RealMetatron
19 hours agoHasan Piker got HUMBLED in New York
684 -
 LIVE
LIVE
Viss
2 hours ago🔴LIVE - Helping Those That Need It Today - Arc Raiders!
124 watching -
 43:37
43:37
The Rubin Report
2 hours agoTriggernometry Hosts Try to Hide Their Shock at Sam Harris’ Charlie Kirk Claim
19.5K25 -
 LIVE
LIVE
SOLTEKGG
1 hour ago🟢 Live: Pro Player Returns to Battlefield 6 RED SEC
49 watching -
 LIVE
LIVE
StevieTLIVE
2 hours agoFriday Warzone HYPE: Come Chill, Chat, and Watch Me Fry
18 watching -
 1:00:57
Dr. Eric Berg
3 days agoThe Dr. Berg Show LIVE - November 21, 2025
12.1K9 -
 LIVE
LIVE
Film Threat
18 hours agoWICKED FOR GOOD + SISU 2 + LOADS OF REVIEWS! | Film Threat Livecast
84 watching -
 LIVE
LIVE
The Mel K Show
2 hours agoMORNINGS WITH MEL K - Globalists Continue to Pursue Agenda 2030-While Americans are Being Easily Distracted 11-21-25
717 watching -
 1:02:43
VINCE
4 hours agoDid The Democrats Really Just Commit Treason? | Episode 174 - 11/21/25 VINCE
188K194