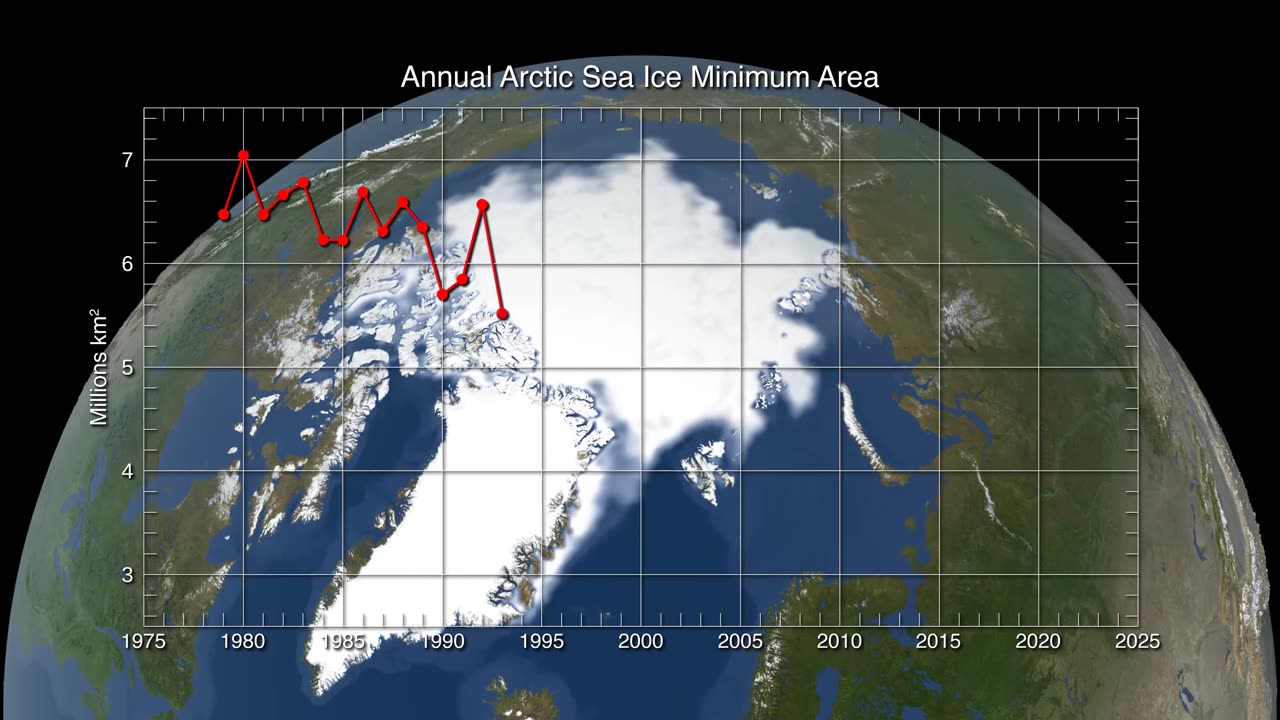
Chart showing the annual arctic sea ice minimum area from 1979 through 2025
5 months ago
22
This chart displays the annual minimum area of Arctic sea ice from 1979 to 2025, highlighting long-term trends and variations in ice extent. The data illustrates the ongoing decline in Arctic sea ice due to climate change, with significant reductions observed over the decades. The minimum sea ice area is recorded each year, typically in September, when the ice reaches its lowest extent before refreezing in the winter.
Loading 1 comment...
-
 LIVE
LIVE
Joe Donuts Live
47 minutes ago🟢 Loot Rats Unleashed: Arena Breakout Chaos! | Joe + Tony + Vlad
1,795 watching -
 11:18
11:18
Dr Disrespect
2 days agoDr Disrespect: THE BEST AND WORST OF GAMESCOM 2025
128K21 -
 LIVE
LIVE
Boxin
31 minutes agoGrounded! part 5
210 watching -
 2:10:12
Badlands Media
1 day agoDevolution Power Hour Ep. 383: Epstein, Durham, and the Dictator Narrative
95.6K74 -
 2:40:10
DLDAfterDark
11 hours ago $0.49 earnedDLD Live! Feat. Red Dawn Readiness! Glock FRT's - Striker Fire Safety Concerns - ACE Trigger
40.3K6 -
 2:40:21
BlackDiamondGunsandGear
10 hours agoAre ALL Striker Fired Pistols UNSAFE? // After Hours Armory
52.8K12 -
 LIVE
LIVE
TheSchleppy
5 hours ago✨TheSchleppy✨EWC COUNTER STRIKE 2 GRAND FINAL *MONGOLZ v AURORA*
38 watching -
 6:34:50
SpartakusLIVE
14 hours ago#1 Saturday Spartoons on RUMBLE PREMIUM
126K7 -
 1:04:59
Man in America
15 hours ago“Summoning the Demon” — The AI Agenda Is FAR WORSE Than We Know w/ Kay Rubacek
61.5K46 -
 2:16:48
Tundra Tactical
13 hours ago $0.14 earned🎯💥 The World’s Okayest Gun Show 🔫😂 | LIVE Tonight on Rumble!
44.6K1