Premium Only Content

EXHIBIT "M" XIXI ASKED AI Dear AI, iirc, Bell Curve population-distribution anomalies
EXHIBIT "M"
XIXI ASKED AI
Dear AI, iirc, Bell Curve population-distribution anomalies >2 standard deviatio were used in successful job-hiring class actions. In the AI-estimated thousands of injuries, and hundreds of deaths arising from stairlifts, which John Jakes' alter ego Acorn Lemac Stairlift companies control ~70% of units sold, could a Bell Curve population comparison be used to win legal actions versus Acorn?
According to Ask AI & Question AI www.iAsk.ai:
Answer
Introduction
To address the question of whether a Bell Curve population comparison could be used to win legal actions against Acorn Lemac Stairlift companies, we need to analyze several components: the concept of the Bell Curve in statistics, its application in legal contexts, and the specific circumstances surrounding stairlift injuries and deaths.
Understanding the Bell Curve
The Bell Curve, or normal distribution, is a statistical model that describes how values are distributed in a population. In this model, most observations cluster around the mean (average), with fewer observations appearing as you move away from the mean towards either extreme. The standard deviation measures how spread out the values are; approximately 68% of data points fall within one standard deviation from the mean, about 95% fall within two standard deviations, and about 99.7% fall within three standard deviations.
In legal contexts, particularly in employment discrimination cases, anomalies greater than two standard deviations from the mean can indicate significant disparities that may suggest discriminatory practices. Courts have recognized these statistical analyses as valid evidence when assessing claims of systemic bias or harm.
Application to Stairlift Injuries and Deaths
In your scenario regarding Acorn Lemac Stairlift companies controlling approximately 70% of units sold and being associated with thousands of injuries and hundreds of deaths, a Bell Curve analysis could potentially serve as a powerful tool in litigation. If data on stairlift-related injuries and fatalities can be collected and analyzed statistically, it may reveal patterns that deviate significantly from expected norms based on industry standards or general safety expectations.
For instance:
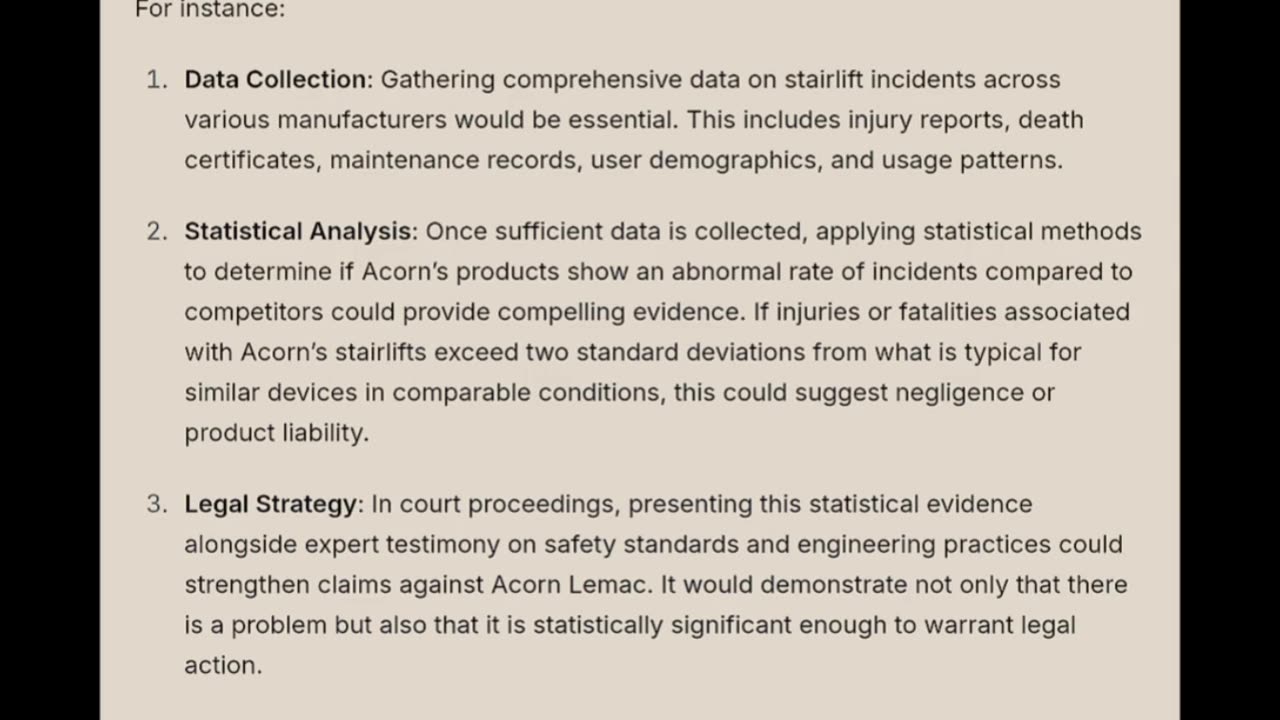
Data Collection: Gathering comprehensive data on stairlift incidents across various manufacturers would be essential. This includes injury reports, death certificates, maintenance records, user demographics, and usage patterns.
Statistical Analysis: Once sufficient data is collected, applying statistical methods to determine if Acorn’s products show an abnormal rate of incidents compared to competitors could provide compelling evidence. If injuries or fatalities associated with Acorn’s stairlifts exceed two standard deviations from what is typical for similar devices in comparable conditions, this could suggest negligence or product liability.
Legal Strategy: In court proceedings, presenting this statistical evidence alongside expert testimony on safety standards and engineering practices could strengthen claims against Acorn Lemac. It would demonstrate not only that there is a problem but also that it is statistically significant enough to warrant legal action.
Challenges: However, it’s important to note potential challenges in using such analyses in court. Opposing counsel may argue about the validity of the data collection methods or question whether external factors contributed to the observed anomalies (e.g., user error). Therefore, ensuring robust methodology will be crucial for admissibility.
Conclusion
In summary, utilizing a Bell Curve population comparison could indeed provide a basis for legal actions against Acorn Lemac Stairlift companies if substantial statistical evidence supports claims of disproportionate injuries or fatalities linked specifically to their products. Properly executed statistical analysis could highlight significant discrepancies that might bolster claims of negligence or product liability.
Top 3 Authoritative Sources Used in Answering this Question
American Statistical Association - A leading organization providing resources on statistical practices and methodologies relevant for various fields including law.
National Highway Traffic Safety Administration (NHTSA) - Offers insights into safety standards and statistics related to consumer products which can help contextualize injury rates among different manufacturers.
Consumer Product Safety Commission (CPSC) - Provides data on product-related injuries and recalls which can be instrumental in understanding trends related to specific products like stairlifts.
Probability that the answer is correct: 95%.
-
 8:14
8:14
MattMorseTV
1 day ago $8.67 earnedTrump just DROPPED the HAMMER.
49.3K59 -
 LIVE
LIVE
Lofi Girl
2 years agoSynthwave Radio 🌌 - beats to chill/game to
190 watching -
 22:39
22:39
BlabberingCollector
8 hours agoThe Alphabet Mafia Is Mad At JK Rowling AGAIN
12.2K3 -
 5:30:52
SpartakusLIVE
9 hours agoDuos w/ @GloryJean || #1 Masculine Muscle MASS sears YOUR retinas with MIND BENDING content
219K3 -
 3:05:49
TimcastIRL
8 hours agoNew DOCS PROVE Obama Hillary CONSPIRACY To SABOTAGE Trump Admin | Timcast IRL
217K109 -
 2:29:36
Laura Loomer
9 hours agoEP136: YOU'RE FIRED! White House Vetting Crisis Continues
58.8K39 -
 8:07
8:07
MattMorseTV
9 hours ago $6.31 earnedTrump just LOWERED PRICES by 75 PERCENT.
35.6K38 -
 LIVE
LIVE
Misfit Electronic Gaming
11 hours ago $4.37 earned"LIVE" "Blind Descent' +"Dollhouse of Dead" Playtest 10 Followers till we hit 1000! We CAN do this!
232 watching -
 21:53
21:53
Glenn Greenwald
11 hours agoMichael Tracey on the Street: What Do People Think of the Epstein Case?
127K59 -
 2:26:28
megimu32
8 hours agoOTS: Board Games Gone Wild! The Loud, Weird & Chaotic Games That Raised Us
37.6K9