Tutorial 211 | Create a rectangle between 2 times and the highest/lowest price between those times
7 months ago
2
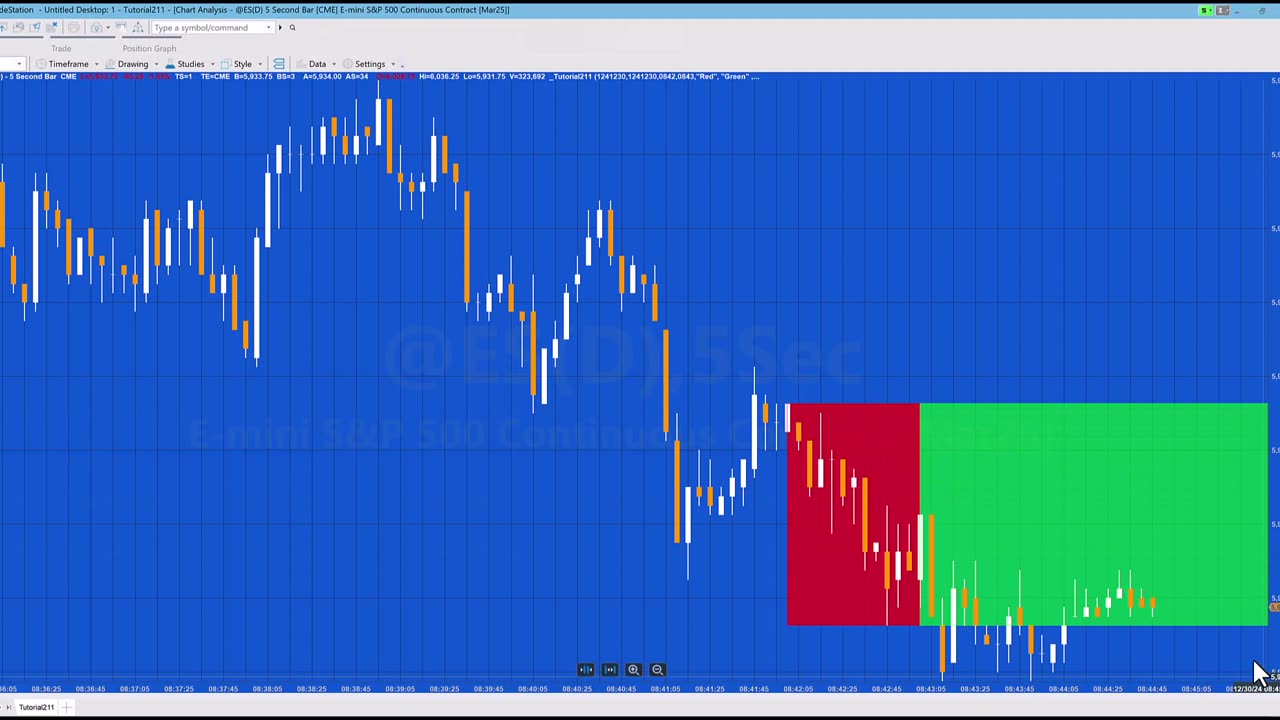
Tutorial 211 explains how to draw a rectangle on a chart between two times with the highs and lows set to be the highest high and the lowest low during the period between the two times. A second rectangle is drawn continuing the first rectangle to the end of the chart. The rectangles are drawn using a method.
The tutorial also shows how to convert dates and time to DateTime format and how to created DateTime points.
The tutorial program is able to draw rectangles for historical times that have already passed as well as future bars.
Loading comments...
-
 LIVE
LIVE
Misfit Electronic Gaming
5 hours ago"LIVE" "Blind Descent' +"Dollhouse of Dead" Playtest 10 Followers till we hit 1000! We CAN do this!
11 watching -
 21:53
21:53
Glenn Greenwald
4 hours agoMichael Tracey on the Street: What Do People Think of the Epstein Case?
82.6K47 -
 LIVE
LIVE
megimu32
1 hour agoOTS: Board Games Gone Wild! The Loud, Weird & Chaotic Games That Raised Us
130 watching -
 LIVE
LIVE
DamnDanieI
1 hour agoKill First, Loot Later – OTG Live
255 watching -
 56:41
56:41
Donald Trump Jr.
6 hours agoLies, Leaks, and Lawfare: Censorship Corruption Exposed | TRIGGERED Ep.263
112K103 -
 LIVE
LIVE
Precision Rifle Network
3 hours agoS4E25 Guns & Grub - Rex Is Back, I shot the 6.5PRC finally...
37 watching -
 LIVE
LIVE
rhywyn
52 minutes agoうつ
42 watching -
 LIVE
LIVE
RyuMuramasa✧
2 hours agoNEW Everdark Sovereign | Elden Ring Nightreign | LIVE Playthrough
48 watching -
 1:17:04
Nikko Ortiz
10 hours agoLive - News, Politics, Podcast And Naaah Im Playin We Chillen
1.99K -
 1:26:13
Mally_Mouse
4 hours agoLet's Hang!! -- P.O. Box & Chill!
9.71K